
Figures & data
Table 1 Comparison of baseline characteristics of the BD-II patients and healthy controls
Figure 1 Study flow chart.
Abbreviation: BD-II, bipolar-II disorder.
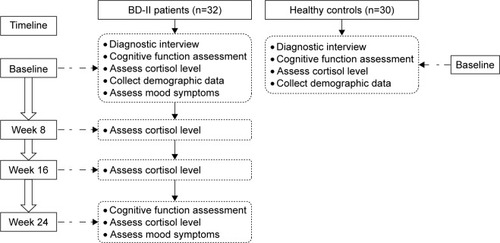
Table 2 Characteristics, cortisol level, and performance of cognitive test in the BD-IIpatients at baseline and each follow-up
Figure 2 Changes in cortisol level at baseline and endpoint.
Abbreviation: BD-II, bipolar-II disorder.
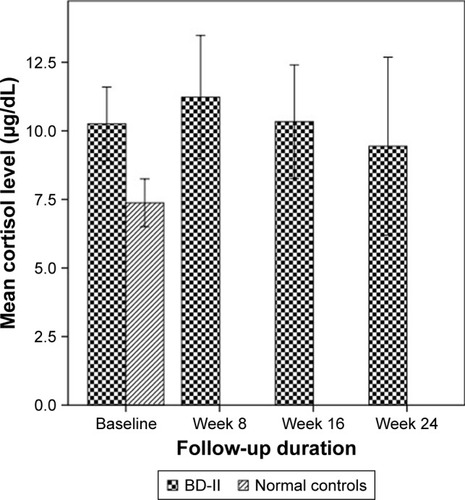
Figure 3 Changes of BACA and all subscores of BACA at baseline and endpoint (week 24).
Notes: (A) Mean BACA total (composite T score); (B) Mean Verbal Memory (T score); (C) Mean Token Motor (T score); (D) Mean Digit Sequencing (T score); (E) Mean Verbal Fluency (T score); (F) Mean Symbol Coding (T score); (G) Mean Tower of London (T score); (H) Mean affective composite (T score).
Abbreviations: BACA, Brief Assessment of Cognition in Affective Disorders; BD-II, bipolar-II disorder.
Abbreviations: BACA, Brief Assessment of Cognition in Affective Disorders; BD-II, bipolar-II disorder.
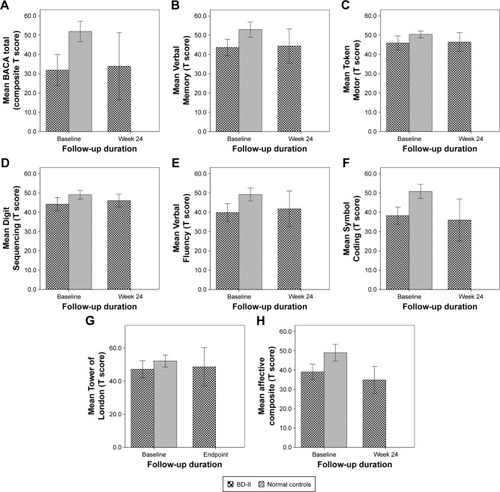
Table 3 Correlation between levels of cortisol and cognitive testing (BACA) over 24 weeks of follow-up
Table S1 Correlations between cortisol and all BACA scales at baseline
Table S2 Correlation between levels of cortisol and cognitive testing (BACA) in mixed-state BD-II patients over 24 weeks of follow-up