
Figures & data
Table 1 Sociodemographic characteristics of the two samples
Table 2 Groups comparison on RBMT and RBMT subtests SPS
Figure 1 Percentage of abnormal scores on RBMT and FAB subtests.
Abbreviations: FAB, Frontal Assessment Battery; PD, Parkinson’s disease; RBMT, Rivermead Behavioral Memory Test.
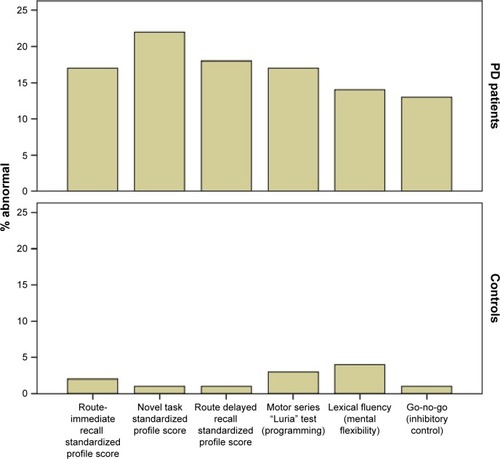
Table 3 Groups comparison on FAB
Table 4 Correlations between RMBT total and subtests SPS and FAB total score and subtests scores in PD group