
Figures & data
Table 1 Brain regions showing significant differences on ALFF between the Alex group and the Cont group
Figure 1 Brain regions showing significant differences on ALFF between Alex and Cont group.
Notes:
P<0.01, AlphaSim correction, cluster size >21; red and yellow color means Alex > Cont; blue and green color means Alex < Cont.
Abbreviations: Alex, alexithymia group; ALFF, amplitude of low-frequency fluctuations; Cont, control group.
Abbreviations: Alex, alexithymia group; ALFF, amplitude of low-frequency fluctuations; Cont, control group.
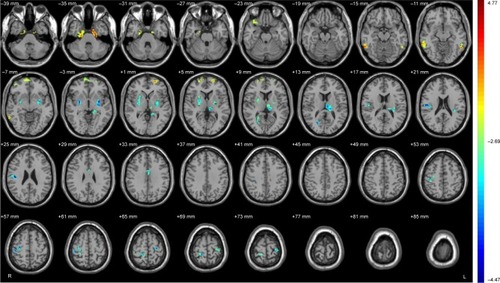
Table 2 Fourteen pairs of regions showing significant differences on FC between the Alex group and the Cont group
Figure 2 The pairs of regions showing the significant differences on FC or FA between the Alex group and the Cont group.
Notes: Red ball means Alex > Cont on ALFF; green ball means Alex < Cont on ALFF; gray line means the difference on FC between the Alex group and the Cont group is statistically significant; blue line means the difference on FA between the Alex group and the Cont group is statistically significant.
Abbreviations: ACC, anterior cingulate cortex; Alex, alexithymia group; ALFF, amplitude of low-frequency fluctuations; Cont, control group; HIP, hippocampus; INS, insula; ITG.L, inferior temporal gyrus, left; ITG.R, inferior temporal gyrus, right; PHG, parahippocampal gyrus; PreCG, precentral gyrus; PostCG, postcentral gyrus; PUT.L, PUTAMEN, left; PUT.R, Putamen, right; SFG.L, superior frontal gyrus, left; SFG.R, superior frontal gyrus, right; THA.L, thalamus_L; V1, primary visual cortex; OrbPFC.R, orbitofrontal cortex, right.
Abbreviations: ACC, anterior cingulate cortex; Alex, alexithymia group; ALFF, amplitude of low-frequency fluctuations; Cont, control group; HIP, hippocampus; INS, insula; ITG.L, inferior temporal gyrus, left; ITG.R, inferior temporal gyrus, right; PHG, parahippocampal gyrus; PreCG, precentral gyrus; PostCG, postcentral gyrus; PUT.L, PUTAMEN, left; PUT.R, Putamen, right; SFG.L, superior frontal gyrus, left; SFG.R, superior frontal gyrus, right; THA.L, thalamus_L; V1, primary visual cortex; OrbPFC.R, orbitofrontal cortex, right.
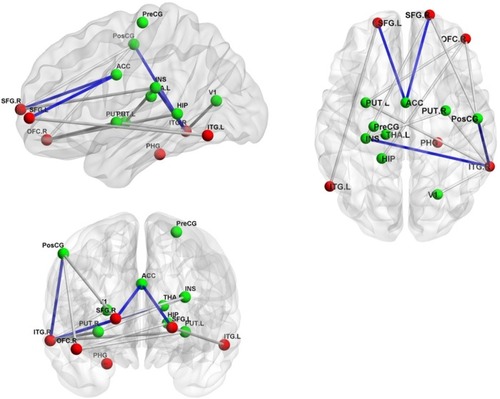
Table 3 Brain regions showing significant differences on fractional anisotropy between the Alex group and the Cont group