
Figures & data
Figure 1 Study design and selection of participants, including initial target for number of respondents.
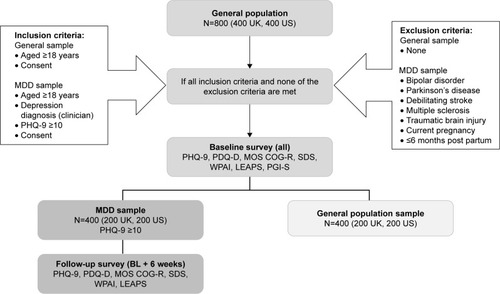
Figure 2 Subject disposition.
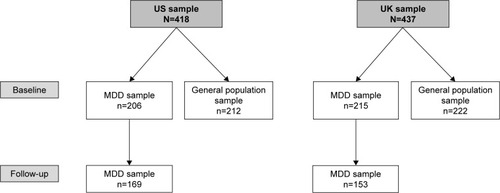
Table 1 Comparison of baseline demographic characteristics and baseline patient-reported scores for US and UK MDD samples
Table 2 Response frequency distributions and descriptive statistics for PDQ-D items at baseline
Table 3 Internal consistency reliability: PDQ-D scale-level properties at baseline for US and UK MDD samples
Table 4 Convergent validity: Pearson correlation coefficients between baseline PDQ-D subscale and total scores and baseline scores from other survey measures in the US and UK study populations with MDD
Table 5 Mean comparison across MDD and general populations for testing known-groups validity of baseline PDQ-D total and subscale scores
Figure 3 Known-groups validity: mean baseline PDQ-D subscale and total scores for the MDD and general populations: (A) US sample; (B) UK sample. *P<0.001 vs general population sample.
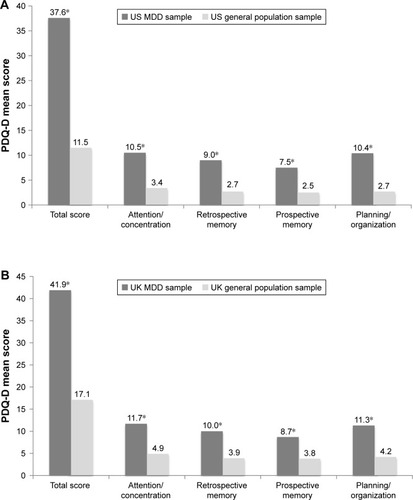
Table 6 Responsiveness to change: Comparison of mean changes from baseline in PDQ-D subscale and total scores for respondents with MDD as a function of their classification based on worsening, no change, or improvement from baseline to follow-up in PHQ-9 score