Figures & data
Figure 1 VFT task design.
Note: Four-block (vegetables, domestic applications, four-legged animals, and fruits) semantic category versions of VFT included a 30-second pre-task baseline, a 30-second VFT, and a 30-second post-task baseline.
Abbreviation: VFT, verbal fluency task.
Abbreviation: VFT, verbal fluency task.
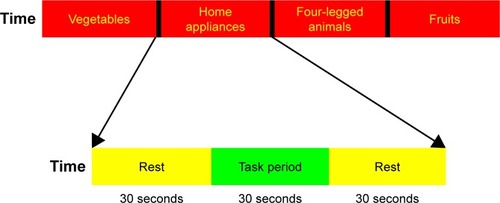
Table 1 Characteristics of subjects
Figure 2 A map showing statistically significant lower oxy-Hb changes in BDn patients compared with the controls during the VFT.
Notes: Channels in color show significantly lower oxy-Hb changes during the VFT in BDn compared with healthy controls (FDR-corrected P<0.2). Channels in gray show FDR-corrected P-values >0.2.
Abbreviations: BDn, bipolar disorder patients absence of psychotic symptoms; FDR, false discovery rate; oxy-Hb, oxygenated hemoglobin; VFT, verbal fluency test.
Abbreviations: BDn, bipolar disorder patients absence of psychotic symptoms; FDR, false discovery rate; oxy-Hb, oxygenated hemoglobin; VFT, verbal fluency test.
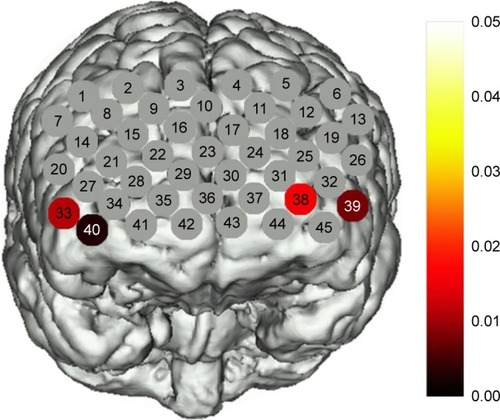
Figure 3 A map showing statistically significant lower oxy-Hb changes in BDp patients compared with the controls during the VFT.
Notes: Channels in color show significantly lower oxy-Hb changes during the VFT in BDp compared with HC (FDR-corrected P<0.2). Channels in gray show FDR-corrected P-values >0.2.
Abbreviations: BDp, bipolar disorder patients presence of psychotic symptoms; FDR, false discovery rate; HC, healthy controls; oxy-Hb, oxygenated hemoglobin; VFT, verbal fluency test.
Abbreviations: BDp, bipolar disorder patients presence of psychotic symptoms; FDR, false discovery rate; HC, healthy controls; oxy-Hb, oxygenated hemoglobin; VFT, verbal fluency test.
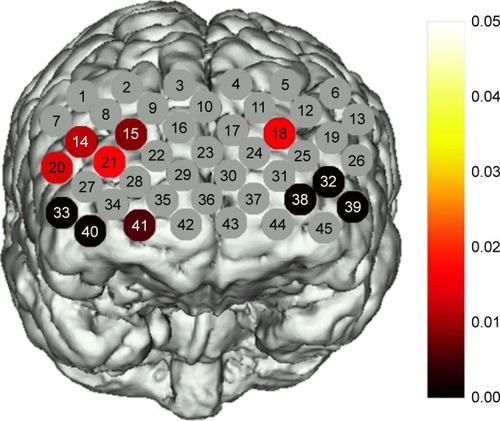
Figure 4 Histogram of the average oxy-Hb concentrations changes in the four channels.
Note: Both BDp and BDn groups showed significantly reduced activation in the four channels than HC (FDR-corrected P<0.2).
Abbreviations: BDp, bipolar disorder patients presence of psychotic symptoms; BDn, bipolar disorder patients absence of psychotic symptoms; FDR, false discovery rate; HC, healthy controls; oxy-Hb, oxygenated hemoglobin.
Abbreviations: BDp, bipolar disorder patients presence of psychotic symptoms; BDn, bipolar disorder patients absence of psychotic symptoms; FDR, false discovery rate; HC, healthy controls; oxy-Hb, oxygenated hemoglobin.
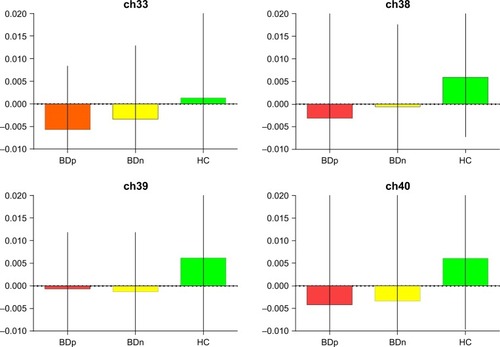
Figure 5 A map showing statistically significant lower oxy-Hb changes in BDp patients compared with BDn during the VFT.
Notes: Channels in color show significantly lower oxy-Hb changes during the VFT in BDp compared with BDn (FDR-corrected P<0.2). Channels in gray show FDR-corrected P-values >0.2.
Abbreviations: BDp, bipolar disorder patients presence of psychotic symptoms; BDn, bipolar disorder patients absence of psychotic symptoms; FDR, false discovery rate; oxy-Hb, oxygenated hemoglobin; VFT, verbal fluency test.
Abbreviations: BDp, bipolar disorder patients presence of psychotic symptoms; BDn, bipolar disorder patients absence of psychotic symptoms; FDR, false discovery rate; oxy-Hb, oxygenated hemoglobin; VFT, verbal fluency test.
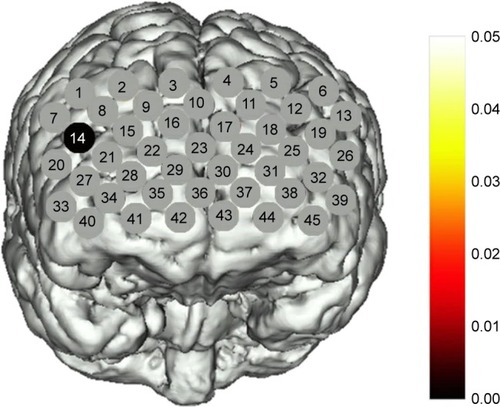
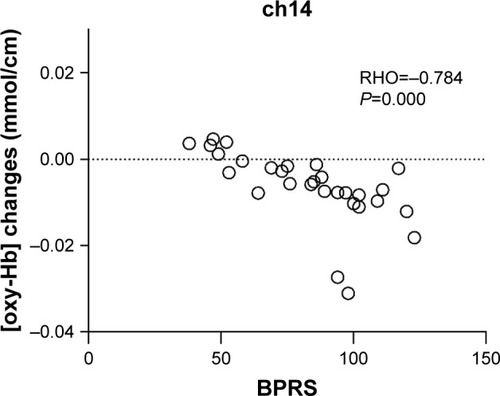
Figure 6 Scatter plot of the oxy-Hb changes in channel 14 changing with BPRS scores.
Note: oxy-Hb changes of channel 14 were negatively correlated with BPRS scores.
Abbreviations: BPRS, Brief Psychiatric Rating Scale; oxy-Hb, oxygenated hemoglobin.
Abbreviations: BPRS, Brief Psychiatric Rating Scale; oxy-Hb, oxygenated hemoglobin.