Figures & data
Table 1 Distribution of the studied children by sociodemographic and disease-related criteria
Figure 1 Relative frequency of the presenting manifestations among the studied PKU patients.
Abbreviation: PKU, phenylketonuria.
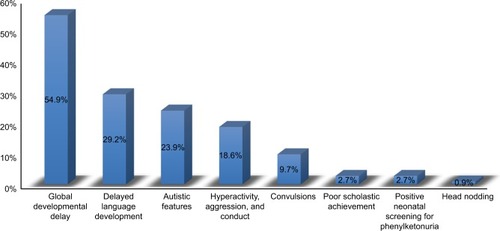
Figure 2 Distribution of the studied PKU children according to time of diagnosis (N=113).
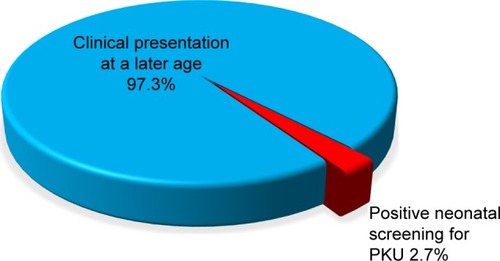
Table 2 Neurological examination and investigations done for the studied children
Table 3 Distribution of the studied children according to the developmental outcome
Table 4 Psychometric evaluation of the studied patients
Table 5 Sociodemographic and disease-related criteria of patients with regard to different outcomes of motor function groups
Table 6 Logistic regression analysis of predictor variables of poor motor and language outcome
Figure 3 Frequency of WMA and brain atrophic changes among PKU patients in relation to various motor function group outcomes.
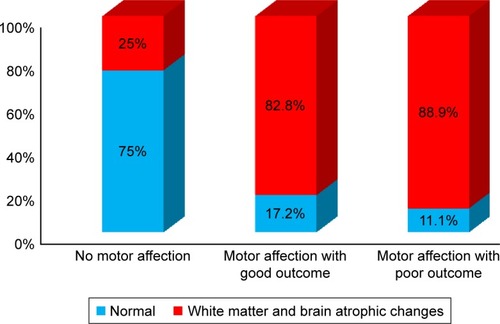
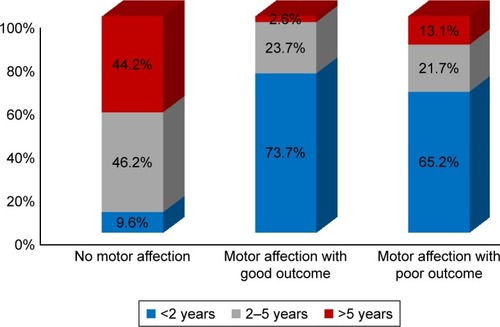
Figure 4 Motor function outcomes with regard to the age of the patients.