
Figures & data
Table 1 Demographic features of schizophrenia patients and healthy controls
Table 2 Expression levels of genes in schizophrenia patients compared with healthy controls
Figure 1 (A) Correlation between VDR and CYP27 expressions. (B) Correlation between VDR and CYP24A1 expressions. (C) Correlation between CYP27 and CYP24A1 expressions.
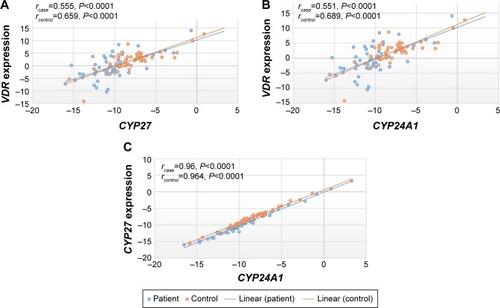
Figure 2 (A) Correlation between VDR expression and age. (B) Correlation between CYP27 expression and age. (C) Correlation between CYP24A1 expression and age.
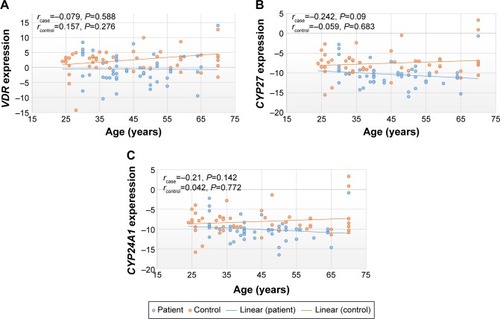
Figure 3 The role of vitamin D in four pathways involved in the etiology of schizophrenia.
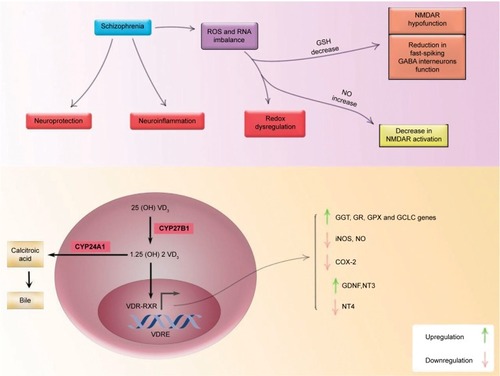
Table S1 The sequences of probes and primers