
Figures & data
Table 1 Basic characteristics of the study patients with acute ischemic stroke
Table 2 The mean levels of inflammatory markers in all patients with ischemic stroke compared to controls
Figure 1 Mean serum levels of (A) neopterin and (B) sCD40 ligand in acute ischemic stroke patients with favorable and unfavorable outcomes 90 days later. Error bars indicate 95% CI values.
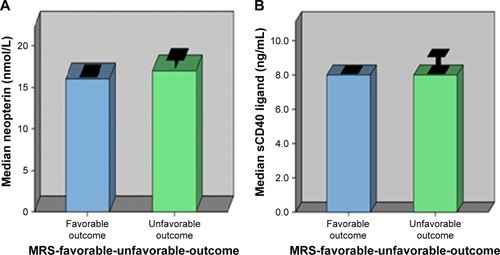
Table 3 Distribution of serum neopterin and sCD40 ligand levels in stroke patients with favorable and unfavorable outcomes (90 days later)
Figure 2 Mean serum levels of (A) neopterin and (B) sCD40 ligand in survivors and those who died with acute ischemic stroke. Error bars indicate 95% CI values. Abbreviation: sCD40, soluble CD40.
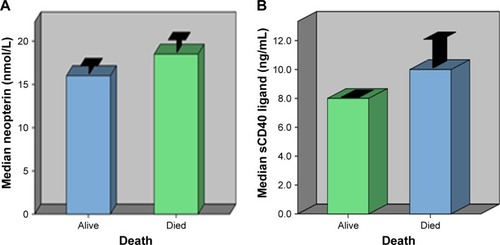
Table 4 Distribution of serum neopterin and sCD40 Ligand levels according to survival status
Figure 3 The ROC curve showed the optimal cutoff value of serum (A) neopterin levels, (B) sCD40 ligand levels, and (C) CRP levels as an indicator for prediction of poor functional outcome and mortality.
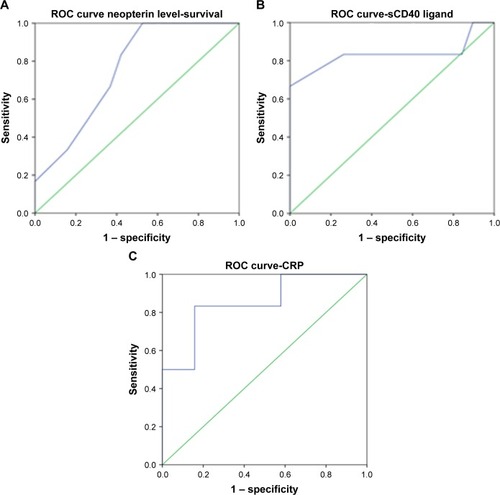
Table 5 Prediction of functional outcome and mortality in AIS patients
Figure 4 Correlation between mean serum levels of (A) neopterin and (B) sCD40 ligand with functional outcome assessed by modified Rankin Scale (mRS), and (C) correlation between mean serum levels of neopterin and sCD40 ligand. Abbreviation: sCD40, soluble CD40.
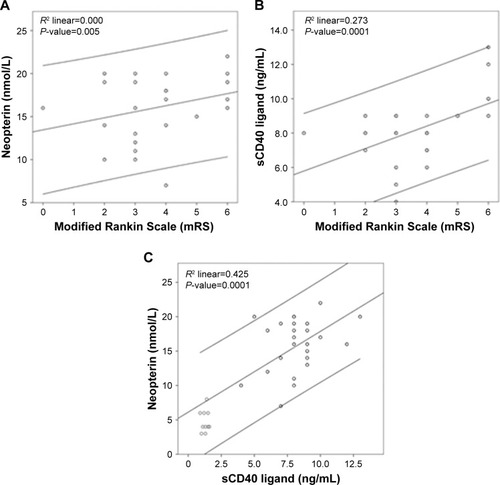
Table 6 Correlation of the serum levels of neopterin, sCD40 ligand, and CRP with the stroke severity and the functional outcome in patients with ischemic stroke
Table 7 Correlation of the serum levels of neopterin and sCD40 ligand with the risk factors of stroke in patients with ischemic stroke
Table 8 Multivariate logistic regression analysis for determining the role of neopterin, sCD40 ligand, and CRP in predicting mortality in our patients with acute ischemic stroke