Figures & data
Table 1 Characteristics of alcohol dependents and healthy subjects
Table 2 The ALFF differences between patients with alcohol dependence and healthy subjects
Figure 1 Altered ALFF areas in patient with alcohol dependence relative to healthy subject.
Notes: Results of one-sample t-test (A, B) and two-sample t-test (C, D). Red color, increased ALFF areas; blue color, decreased ALFF areas.
Abbreviations: ALFF, amplitude of low-frequency fluctuation; L, left; R, right.
Abbreviations: ALFF, amplitude of low-frequency fluctuation; L, left; R, right.
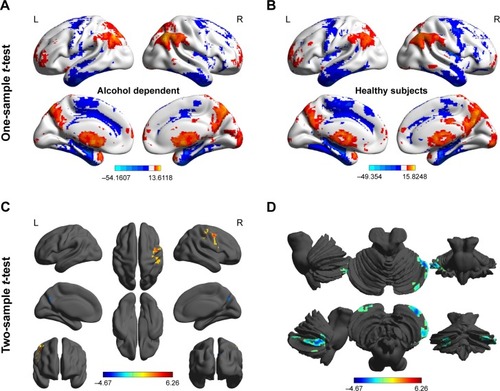
Table 3 ROC curve for ALFF differences in brain areas between alcohol dependent and healthy subjects
Figure 2 Mean β value of ALFF differences in regional brain areas.
Abbreviations: ALFF, amplitude of low-frequency fluctuation; CPL, cerebellum posterior lobe; IPL, inferior parietal lobule; L, left; PG, precentral gyrus; Prc, precuneus; R, right.
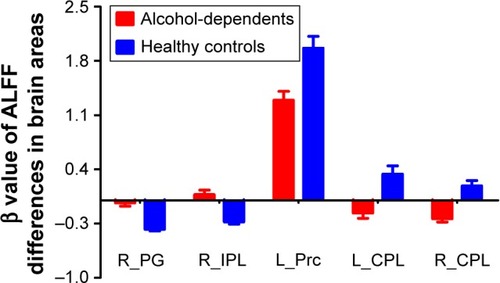
Figure 3 ROC curve analysis of ALFF differences in regional brain areas.
Note: ROC curve of higher (A) and lower (B) ALFF in brain areas.
Abbreviations: ALFF, amplitude of low-frequency fluctuation; L, left; R, right; ROC, receiver operating characteristic.
Abbreviations: ALFF, amplitude of low-frequency fluctuation; L, left; R, right; ROC, receiver operating characteristic.
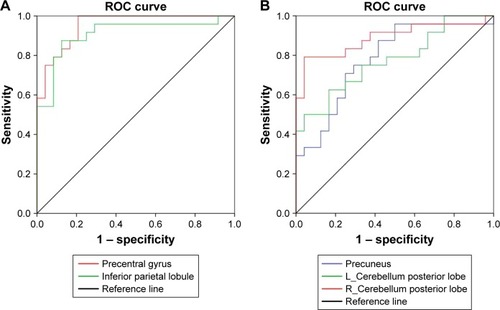
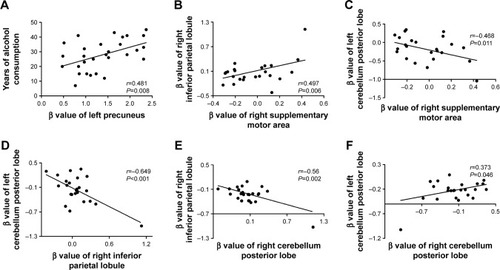
Figure 4 Pearson correlation among characteristics of alcohol dependent and β value of ALFF differences in brain areas.
Note: Correlation between years of alcohol consumption and left precuneus (A), and among ALFF differences in brain areas (B–F).
Abbreviation: ALFF, amplitude of low-frequency fluctuation.
Abbreviation: ALFF, amplitude of low-frequency fluctuation.