Figures & data
Table 1 Top ten up- and downregulated DElncRNAs between PD and normal controls
Table 2 Top ten up- and downregulated DEmRNAs between PD and normal controls
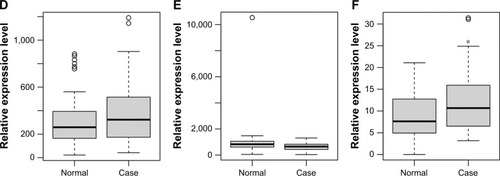
Figure 1 DElncRNAs and DEmRNAs between PD and normal controls.
Notes: (A, B) Hierarchical clustering results of DElncRNAs and top 100 DEmRNAs between PD and normal controls, respectively. Row and column represent DElncRNAs/DEmRNAs and tissue samples, respectively. The color scale represents the expression levels. (C) Distribution of DElncRNAs and DEmRNAs on chromosomes. The outer layer cycle was the chromosome map of the human genome hg19 (GRCh37). The red and blue inner layer represents the distribution of up- and downregulated DEmRNAs on different chromosomes, respectively. The pink and light blue inner layer represents the distribution of up- and downregulated DElncRNAs on different chromosome, respectively.
Abbreviations: DElncRNAs, differentially expressed long noncoding RNAs; DEmRNAs, differentially expressed micro RNAs; PD, Parkinson’s disease.
Abbreviations: DElncRNAs, differentially expressed long noncoding RNAs; DEmRNAs, differentially expressed micro RNAs; PD, Parkinson’s disease.
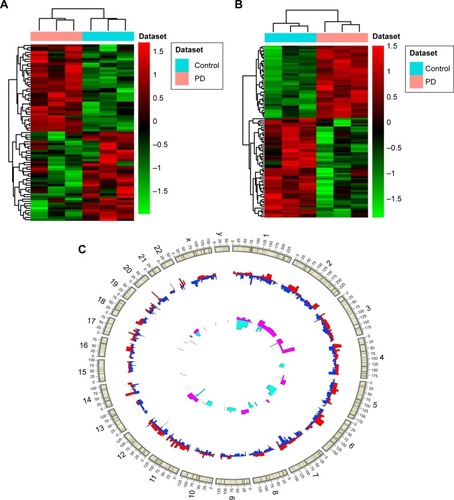
Figure 2 Significantly enriched GO terms and KEGG pathways of DEmRNAs between PD and normal controls.
Notes: (A) BP, (B) CC, (C) MF, and (D) KEGG pathways. The x-axis shows counts of DEmRNAs enriched in GO terms or KEGG pathways and the y-axis shows GO terms or KEGG pathways. The color scale represented −log FDR.
Abbreviations: BP, biological process; CC, cellular component; DEmRNAs, differentially expressed mRNAs; FDR, false discovery rate; GO, gene ontology; KEGG, Kyoto Encyclopedia of Genes and Genomes; MF, molecular function.
Abbreviations: BP, biological process; CC, cellular component; DEmRNAs, differentially expressed mRNAs; FDR, false discovery rate; GO, gene ontology; KEGG, Kyoto Encyclopedia of Genes and Genomes; MF, molecular function.
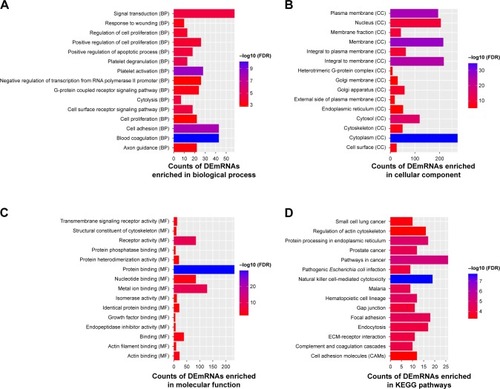
Figure 3 PD-specific PPI network.
Notes: The red and blue ellipses represent proteins encoded by up- and downregulated DEmRNAs between PD and normal control. Ellipses with black and blue border are DEmRNAs derived from top ten down- and upregulated DEmRNAs between PD and normal control.
Abbreviations: DEmRNAs, differentially expressed mRNAs; PD, Parkinson’s disease; PPI, protein–protein interaction.
Abbreviations: DEmRNAs, differentially expressed mRNAs; PD, Parkinson’s disease; PPI, protein–protein interaction.
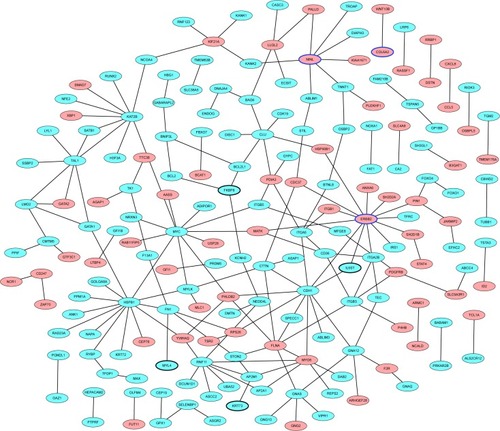
Table 3 Nearby targeted DEmRNAs of DElncRNAs between PD and normal controls
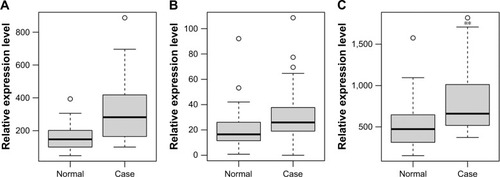
Figure 4 Validation of selected DEmRNAs in GSE57475.
Notes: The x-axis shows PD and normal control groups and the y-axis shows relative expression levels. (A) TAL1; (B) TREML1; (C) TREML4; (D) ERBB2; (E) CX3CR1; (F) ANK1. The circles represent outliers.
Abbreviations: DEmRNAs, differentially expressed micro RNAs; PD, Parkinson’s disease.
Abbreviations: DEmRNAs, differentially expressed micro RNAs; PD, Parkinson’s disease.
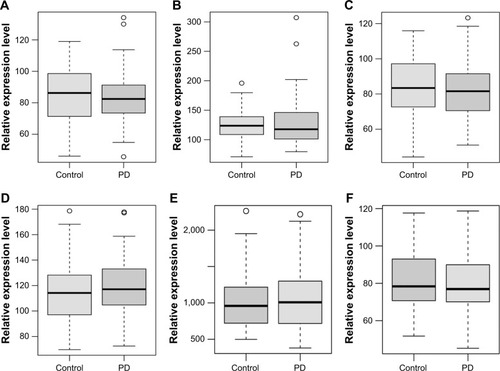
Figure 5 Validation of selected DEmRNAs in GSE68719.
Notes: The x-axis shows PD and normal control groups and the y-axis shows relative expression levels. (A) TAL1; (B) TREML1; (C) ERBB2; (D) CX3CR1; (E) ANK1; (F) KLRD1. The circles represent outliers. *P < 0.05 and **P < 0.01.
Abbreviations: DEmRNAs, differentially expressed micro RNAs; PD, Parkinson’s disease.
Abbreviations: DEmRNAs, differentially expressed micro RNAs; PD, Parkinson’s disease.