Figures & data
Table 1 Demographics and clinical features among DMSA, NDMSA, and HCs
Table 2 Difference of functional connectivity between DMSA patients and HCs
Figure 1 Statistical parametric map showing the significant differences in left and right AMY FC differences between DMSA patients and HCs (left AMY, cluster size >14, P<0.001 and right AMY cluster size >9, P<0.001 AlphaSim corrected); differences between NDMSA and HC (left AMY, cluster size >47, P<0.001 and right AMY cluster size >64, P<0.001 AlphaSim corrected).
Abbreviations: AMY, amygdala; DMSA, multiple system atrophy patients with depression; FC, functional connectivity; HC, healthy control; L, left; NDMSA, multiple system atrophy patients without depression; R, right.
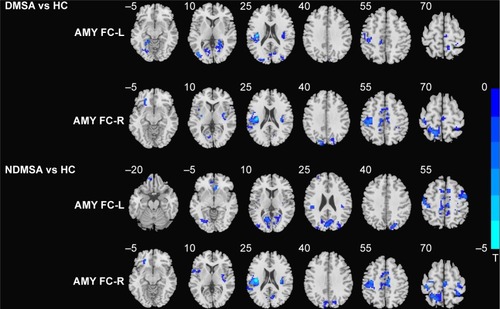
Table 3 Difference of functional connectivity between NDMSA patients and HCs
Table 4 Difference of functional connectivity between DMSA and NDMSA patients
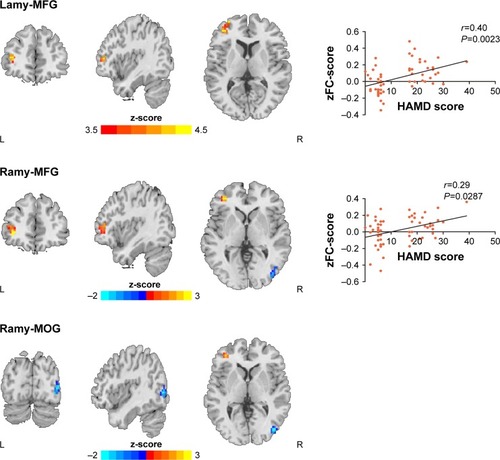
Figure 2 Statistical parametric map showing the significant differences between DMSA and NDMSA patients (P<0.001, AlphaSim corrected); Blue denotes decreased FC in DMSA group than NDMSA group, red denotes increased FC in DMSA group than NDMSA group.
Abbreviations: AMY, amygdala; DMSA, multiple system atrophy patients with depression; FC, functional connectivity; HAMD, Hamilton Depression Rating Scale; MFG, middle frontal gyrus; MOG, middle occipital gyrus; NDMSA, multiple system atrophy patients without depression.