Figures & data
Figure 1 Effects of TSG on infarct size in rats with cerebral ischemia/reperfusion injury. Data are expressed as the mean ± SD (n=3 per group); ##P<0.01 vs control group; *P<0.05, **P<0.01 vs model group.
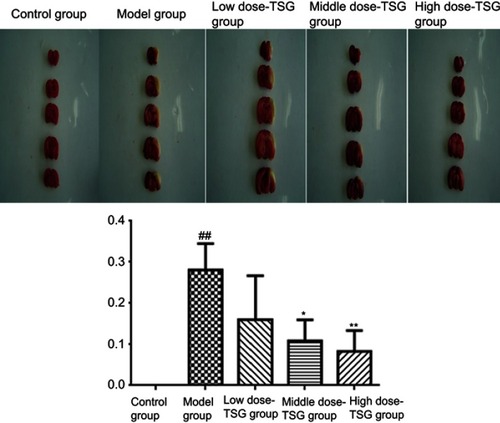
Figure 2 Expression of uncoupling protein 4 (UCP4) at different stages of cerebral ischemia/reperfusion. (A) Control group (the cortex, ×20); (B) ischemia 6 hours (the hippocampus, ×20); (C) ischemia 24 hours (the hippocampus, ×20). (D) Western blot analysis of UCP4 expression. *P<0.05 vs control group, **P<0.01 vs control group, n=3.
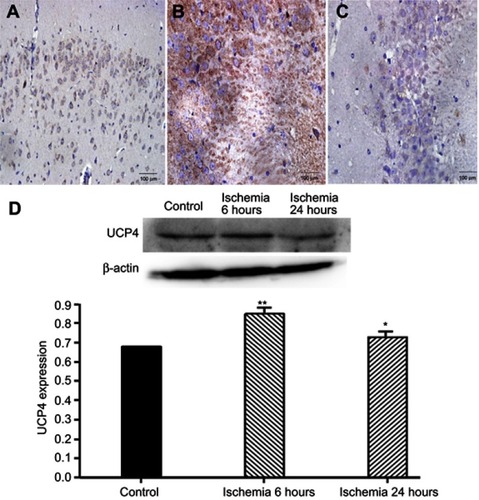
Figure 3 Effects of TSG on uncoupling protein 4 (UCP4) expression in rats with cerebral ischemia/reperfusion injury. Data are expressed as the mean ± SD (n=3 per group); ##P<0.01 vs control group; *P<0.05, **P<0.01 vs model group.
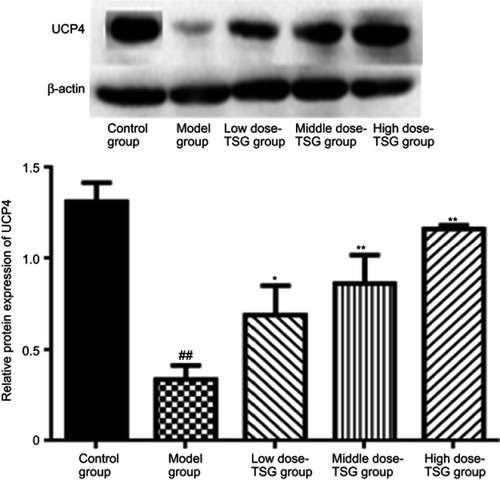
Figure 4 Effects of TSG on 5-hydroxytryptamine (5-HT) content in rats with cerebral ischemia/reperfusion injury. Data are expressed as the mean ± SD (n=3 per group); ##P<0.01 vs control group; *P<0.05, **P<0.01 vs model group.
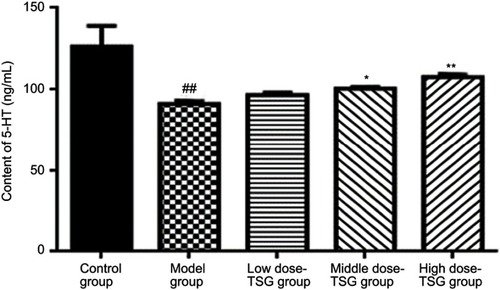
Figure 5 Effects of TSG on 5-hydroxytryptamine transporter (5-HTT) expression in rats with cerebral ischemia/reperfusion injury. Data are expressed as the mean ± SD (n=3 per group); ##P<0.01 vs control group; *P<0.05, **P<0.01 vs model group.
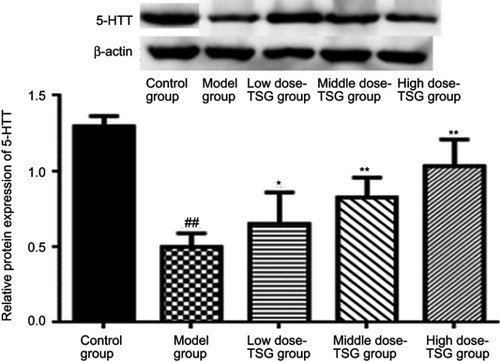
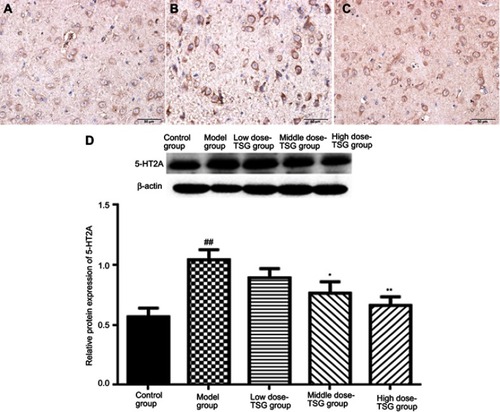
Figure 6 Effects of TSG on 5-hydroxytryptamine receptor 2A (5-HT2A) expression in rats with cerebral ischemia/reperfusion injury. (A) Control group (the thalamic nucleus, ×40); (B) Model group (the thalamic nucleus, ×40); (C) TSG group (the thalamic nucleus, ×40). (D) Western blot analysis of 5-HT2A expression. Data are expressed as the mean ± standard deviation (n=3 per group); ##P<0.01 vs control group; *P<0.05, **P<0.01 vs model group.