Figures & data
Figure 1 Flowchart of the selection strategy and inclusion and exclusion criteria for this meta-analysis.
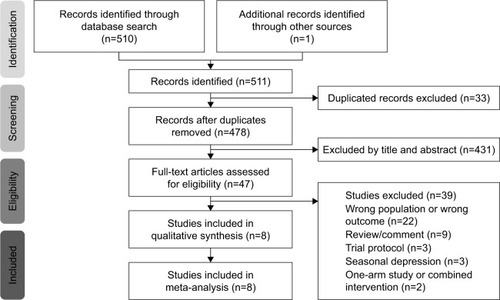
Table 1 Summary of the characteristics of studies in the current meta-analysis
Figure 2 Meta-analysis of studies comparing depression severity before and after light therapy in elderly adults.
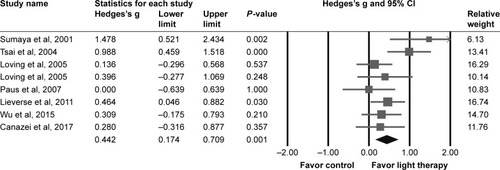
Figure 3 Funnel plots for the effect sizes of light therapy.
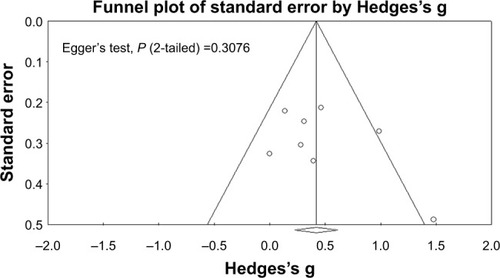
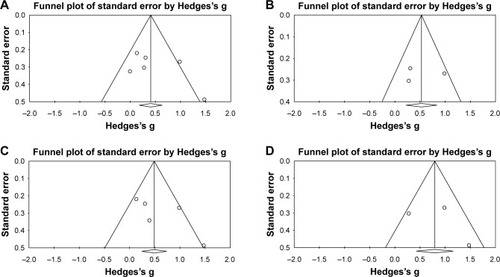
Figure 4 Meta-regression of the effects of (A) female sex, (B) mean age, (C) treatment duration in days, and (D) light intensity in lux.
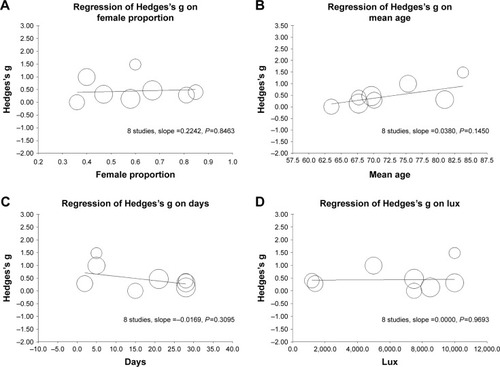
Figure 5 Subgroup meta-analyses of light colors.
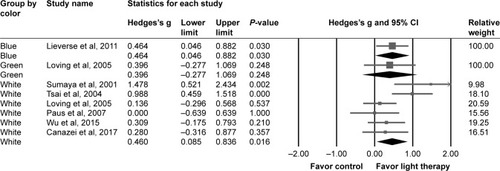
Figure 6 Subgroup meta-analyses of comparators.
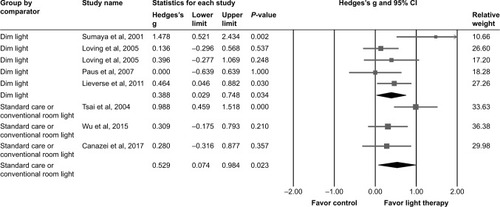
Figure 7 Subgroup meta-analyses of depression measures.
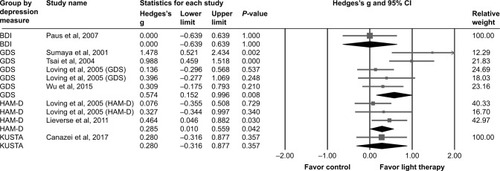
Figure 8 Subgroup meta-analyses of study designs.
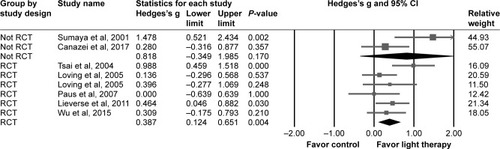
Figure 9 Subgroup meta-analyses of intervention lengths.
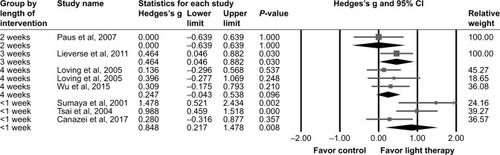
Figure 10 Subgroup meta-analyses of mean age ranges.
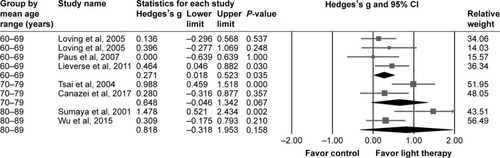
Figure 11 Subgroup meta-analyses of effects at 3-month follow-up after stopping light therapy.
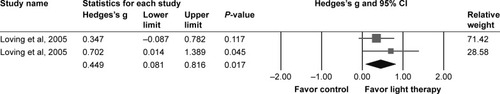
Figure 12 Funnel plots for effect size of subgroup meta-analysis on (A) white light, (B) standard care, (C) GDS, (D) <1 week.