Figures & data
Table 1 Demographic and clinical characteristics of COPD and NCs
Table 2 Two-sample t-test differences between COPD and NCs using ALFF method (P<0.01, GRF-corrected for multiple comparisons at a cluster level of P<0.05)
Figure 1 Differences in ALFF between COPD patients and NCs groups (two-tailed, voxel-level P<0.01; GRF correction, cluster-level P<0.05) are shown in axial position.
Abbreviations: ALFF, amplitude of low-frequency fluctuation; GRF, Gaussian random field; NCs, normal controls; R/L, right/left hemicerebrum.
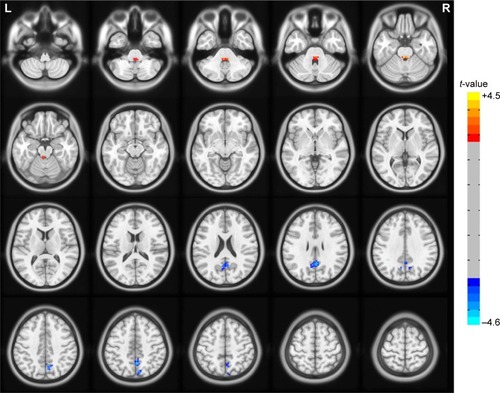
Figure 2 Significant activity differences were observed in PCC, precuneus, and brainstem between COPD patients and NCs groups (two-tailed, voxel-level P<0.01; GRF correction, cluster-level P<0.05) are shown in three-dimensional image.
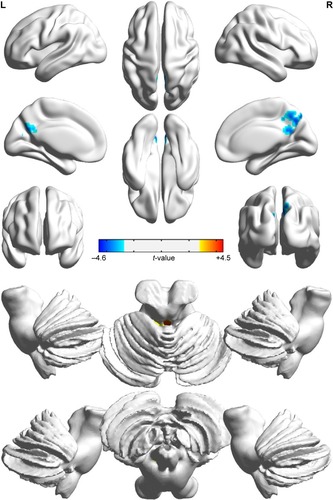
Figure 3 Mean ALFF signal values for altered regional brain areas between COPD patients and NCs.
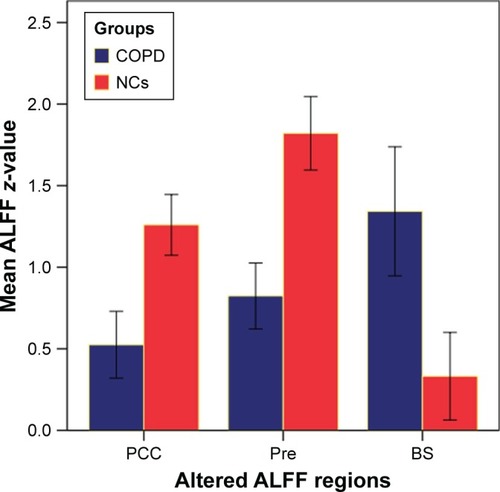
Figure 4 ROC curve analysis of the mean ALFF values for altered brain regions.
Abbreviations: ALFF, amplitude of low-frequency fluctuation; AUC, area under the curve; PCC, posterior cingulate cortex; ROC, receiver operating characteristic.
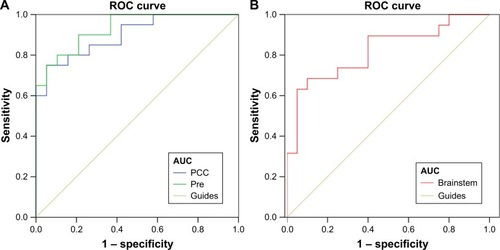
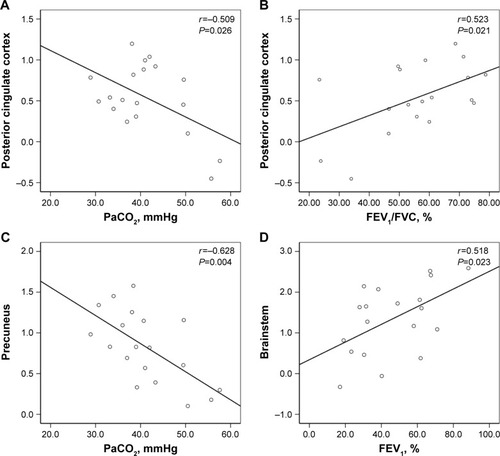
Figure 5 Significant correlation was observed between the ALFF values in the PCC (A, B), precuneus (C), brainstem (D) and the clinical parameters (PaCO2, FEV1/FVC, and FEV1) in the stable COPD patient group.