Figures & data
Table 1 Demographic and clinical characteristics
Figure 1 The significant differences of DTI indices between obese subjects and non-obese HC.
Abbreviations: AD, axial diffusivity; DTI, diffusion tensor imaging; FDR, false discovery rate; HC, healthy controls; MD, mean diffusivity; RD, radial diffusivity.
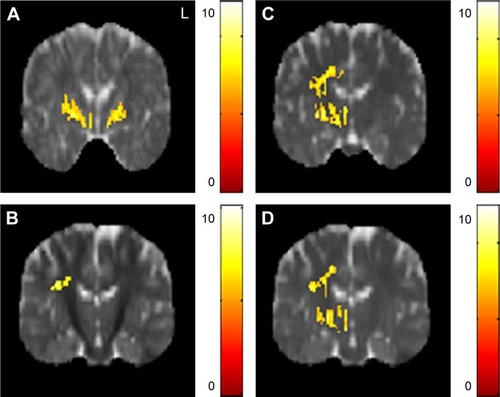
Figure 2 The correlation between DTI indices, BMI, and HADS scores.
Abbreviations: AD, axial diffusivity; BMI, body mass index; DTI, diffusion tensor imaging; FDR, false discovery rate; HADS, Hospital Anxiety and Depression Scale; MD, mean diffusivity; RD, radial diffusivity.
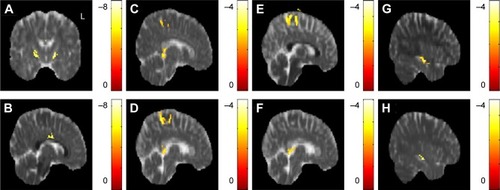
Figure 3 The significant differences of GQI indices between obese subjects and non-obese HC.
Abbreviations: AD, axial diffusivity; DTI, diffusion tensor imaging; GQI, generalized q-sampling imaging; HC, healthy controls; MD, mean diffusivity.
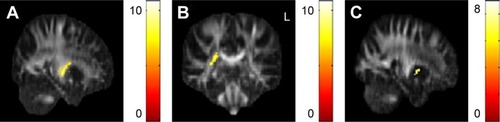
Figure 4 The correlation between GQI indices, BMI, and HADS scores.
Abbreviations: BMI, body mass index; FDR, false discovery rate; GFA, generalized fractional anisotropy; GQI, generalized q-sampling imaging; HADS, Hospital Anxiety and Depression Scale; NQA, normalized quantitative anisotropy.
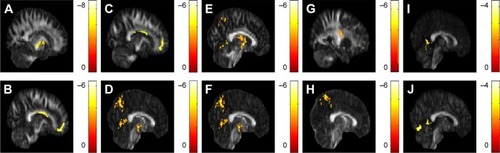
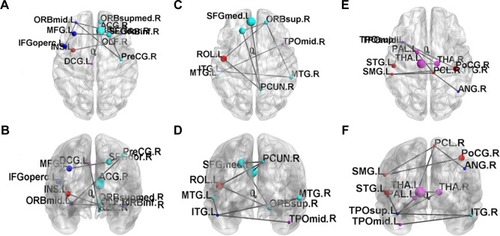
Figure 5 The degree of distribution in the structural network of (A) non-obese healthy controls and (B) obese subjects by graph theoretical analysis with GQI. (C–F) The topological measures of structural networks in obese subjects and non-obese HC by graph theoretical analysis with GQI (P<0.05, corrected by FDR).
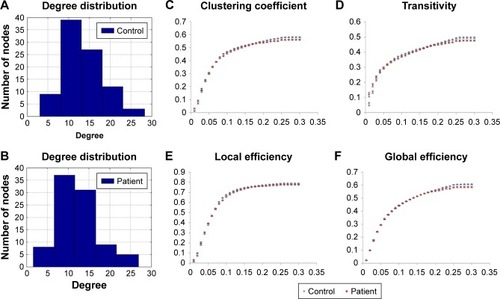
Figure 6 The disrupted sub-networks of obese subjects identified by the NBS with GQI (P<0.001, corrected by FDR).