
Figures & data
Table 1 Demographic and clinical characteristics in the MS and NMS groups (mean ± SD)
Figure 1 Distribution of occupations by skill level in the MS and NMS groups.
Notes: Frequency (%) according to job types compared between MS (gray) and NMS (black). The skill levels are defined as follows: a. professionals; b. managers; c. technicians and associate professors; d. clerical support workers; e. services and sales workers; f. skilled agricultural, forestry, and fishery workers; g. plant and machine operators, and assemblers; h. elementary occupations; i. unemployment; and j. students; *P<0.05 with Fisher’s exact test.
Abbreviations: MS, military service; NMS, nonmilitary service; NOS, not otherwise specified.
Abbreviations: MS, military service; NMS, nonmilitary service; NOS, not otherwise specified.
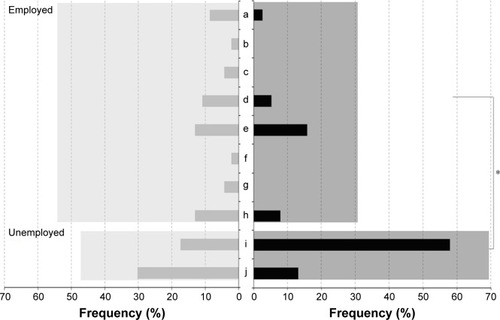
Figure 2 Comorbid psychiatric disorders in the MS and NMS groups.
Notes: (A) Frequency (%) of no comorbidity compared between MS (I) and NMS (II); (B) frequency (%) according to various types of comorbidity psychiatric disorders compared between MS (gray) and NMS (black). 1. depression; 2. anxiety disorder; 3. bipolar disorder; 4. Tic disorder; 5. habit/impulse control disorder; 6. sleep disorder; 7. substance use disorder; 8. personality disorder; 9. psychoticism; 10. stress-related disorder; 11. somatoform disorder; 12. autism spectrum disorder; 13. mental retardation; 14. conduct disorder; 15. other neurotic disorder; 16. mental disorder NOS. *P<0.05; **P<0.01 was considered statistically significant with Fisher’s exact test.
Abbreviations: MS, military service; NMS, nonmilitary service; NOS, not otherwise specified.
Abbreviations: MS, military service; NMS, nonmilitary service; NOS, not otherwise specified.
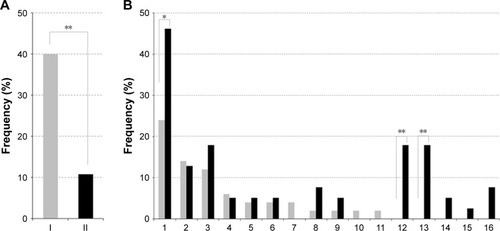
Table 2 Effects of demographic and clinical factors on the status of MS