Figures & data
Table 1 The primer sequences for reverse transcription quantitative PCR
Figure 1 The relative mRNA levels of GABAARα1 and GABAARα4 increased and levels of GAD65, GAT-1, and GAT-3 decreased in epilepsy rats treated with si-HDAC4.
Abbreviation: RT-qPCR, reverse transcription quantitative PCR.
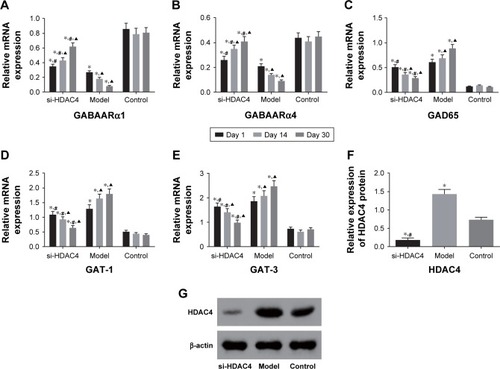
Figure 2 si-HDAC4 elevates the number of positive cells of GABAARα1 (A) and GABAARα4 (B), while reduces that of GAD65 (C), GAT-1 (D), and GAT-3 (E) of the hippocampus tissues of epilepsy rats after treatment with si-HDAC4.
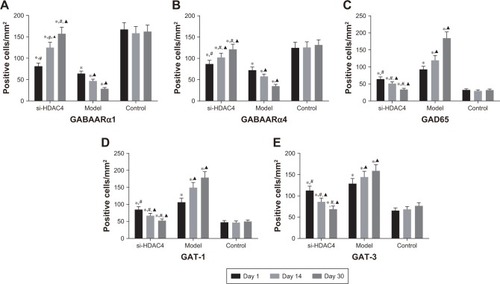
Figure 3 The protein levels of GABAARα1 (A) and GABAARα4 (B) enhanced, while that of GAD65 (C), GAT-1 (D), and GAT-3 (E) reduced in the hippocampus tissues of epilepsy rats after treatment with si-HDAC4.
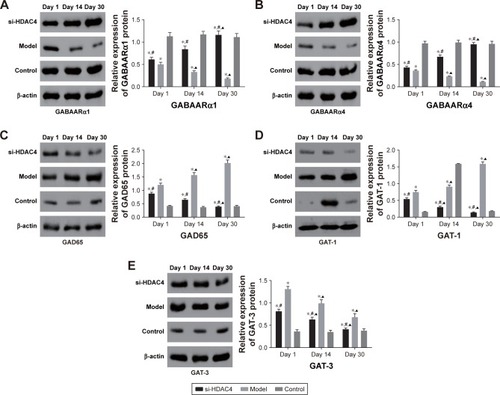
Figure 4 si-HDAC4 inhibits the occurrence of epilepsy using electroencephalogram.
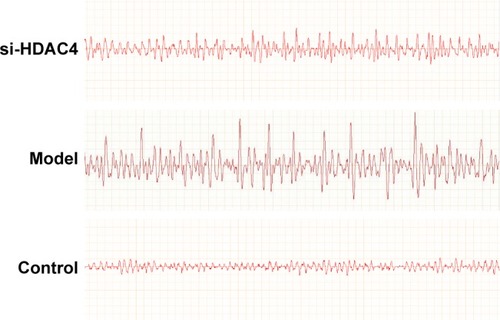
Table 2 Comparisons of rats’ behavior observation among three groups
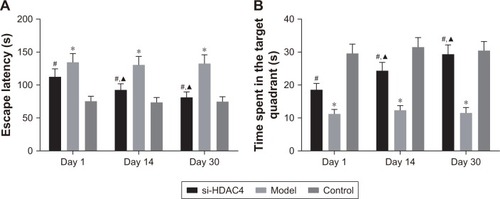
Figure 5 Silence of HDAC4 promotes cognitive function.