
Figures & data
Table 1 Correlation between cognitive performance and psychopathology from T1 to T4
Table 2 Cognitive performance in MCCB – comparison of patients and controls
Figure 1 MATRICS performance of patients in the T3, T4, and control groups in Tc1 and Tc2 (within 6 weeks).
Note: T3, 1 day after the last session; T4, after 6 weeks; Tc1, the first scheduled visit; Tc2, 6 weeks after the first visit.
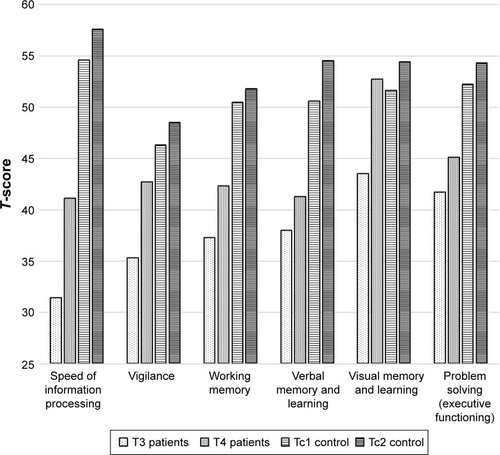
Table 3 Differences in the cognitive performance according to MCCB between the depression and psychosis groups