Figures & data
Table 1 MNI coordinates for selected seed regions
Table 2 Demographics and characteristics of late blindness
Table 3 Significant differences in the FC of V1 between LB and SCs
Figure 1 Significant zFC maps of left V1 differences between two groups.
Abbreviations: GRF, Gaussian random field; iFC, intrinsic functional connectivity; LB, late blindness; LH, left hemisphere; RH, right hemisphere; SCs, sighted controls; V1, primary visual cortex; zFC, z-values functional connectivity.
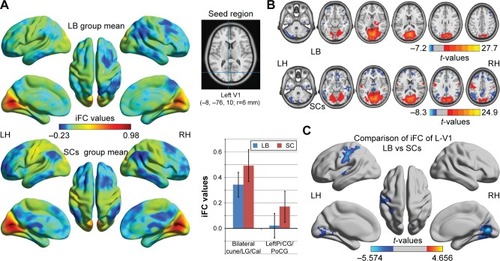
Figure 2 Significant zFC maps of right V1 differences between two groups.
Abbreviations: GRF, Gaussian random field; iFC, intrinsic functional connectivity; LB, late blindness; LH, left hemisphere; RH, right hemisphere; SCs, sighted controls; V1, primary visual cortex; zFC, z-values functional connectivity.
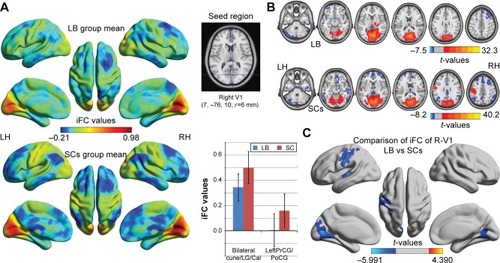
Table 4 Abnormal rs-FC within the vision-related nuclei between two groups
Figure 3 Significant zFC maps of V1 and vision-related nuclei differences between two groups.
Abbreviations: FC, functional connectivity; GRF, Gaussian random field; Hipp, hippocampus; L, left; LB, late blindness; LGN, lateral geniculate nucleus; R, right; SCs, sighted controls; SC, superior colliculus; V1, primary visual cortex.
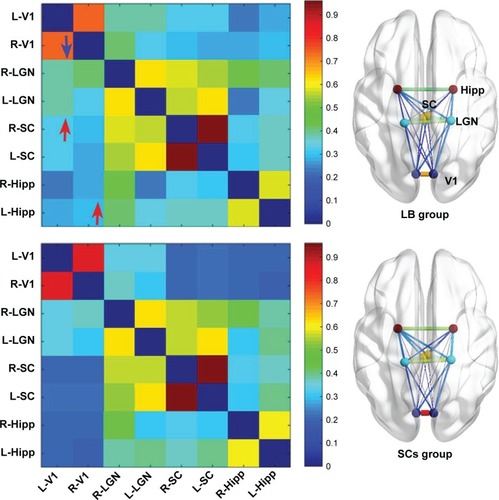
Figure 4 ROC curve analysis of the mean zFC values for altered brain regions.
Abbreviations: AUC, area under the curve; B, bilateral; CAL, calcarine; CUN, cuneus; FC, functional connectivity; L, left; LGG, lingual gyrus; PostCG, postcentral gyrus; PreCG, precentral gyrus; ROC, receiver operating characteristic; V1, primary visual cortex.
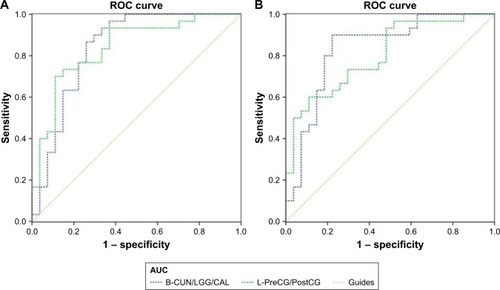
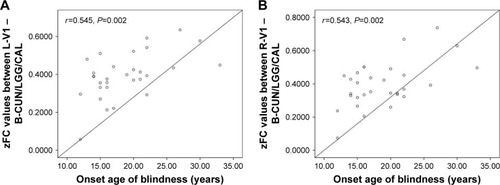
Figure 5 Significant correlation was observed between the onset age of blindness and zFC values in the (A) left V1 (r=0.545, P=0.002) and (B) right V1 (r=0.543, P=0.002) in LB individuals.