Figures & data
Table 1 Clinical and demographic characteristics
Table 2 Changes in symptom evaluation scores during the study
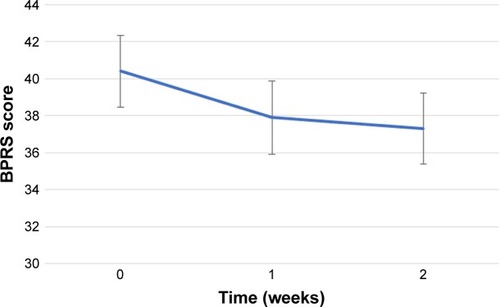
Figure 1 Changes in the BARS global akathisia score.
Notes: Compared with BARS global akathisia score at the baseline, global akathisia score at week 1 and 2 significantly decreased (P=0.01, P=0.01, respectively). Between the BARS global akathisia scores at week 1 and 2, significant difference was not observed. Error bars indicate standard error. *Significant difference between baseline and 1 week after treatment onset (P<0.016). #Significant difference between baseline and 2 weeks after treatment onset (P<0.016).
Abbreviation: BARS, Barnes Akathisia Rating Scale.
Abbreviation: BARS, Barnes Akathisia Rating Scale.
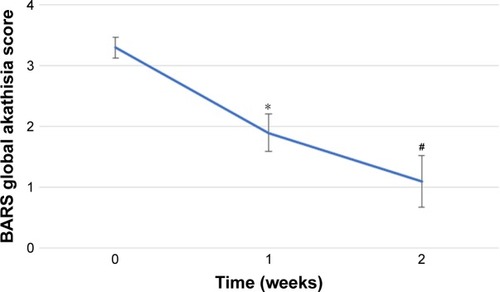
Figure 2 Changes in BPRS scores.
Notes: Any significant difference was not found on BPRS scores in post hoc analyses. Error bars indicate standard error.
Abbreviation: BPRS, Brief Psychiatric Rating Scale.
Abbreviation: BPRS, Brief Psychiatric Rating Scale.