
Figures & data
Figure 1 Statistical maps of thalamocortical connectivity in EO-MDD and AO-MDD patients and HC: (A) six cortical ROIs used as seed regions in the seed-to-voxel analysis of thalamocortical connectivity; (B) the first three rows show group mean clusters from HCs and EO-MDD and AO-MDD patients. The fourth row displays significant clusters showing a main effect of group from ANOVA results; (C) significant clusters emerging from group contrasts (showing only clusters that overlap with group main effects from ANOVA results); (D) overlaid group mean clusters to demonstrate differences in the spatial distribution of thalamocortical connectivity regions in the thalamus across all the three groups.
Abbreviations: ANOVA, analysis of variance; AO, adult onset; EO, early onset; FWE, family-wise error; HC, healthy control; MDD, major depressive disorder; ROIs, regions of interest.
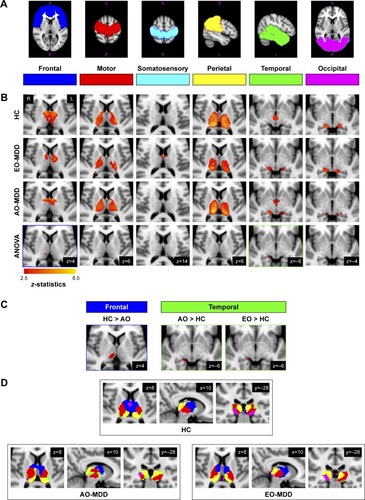
Table 1 Demographic and clinical variables
Table 2 Cluster table showing thalamocortical group differences from group contrasts (only clusters that overlap with those showing the main effects of the group from ANOVA comparing HC, AO-MDD, and EO-MDD patients)