Figures & data
Figure 1 Flowchart of the screening and selection of qualified articles according to the PRISMA statement.
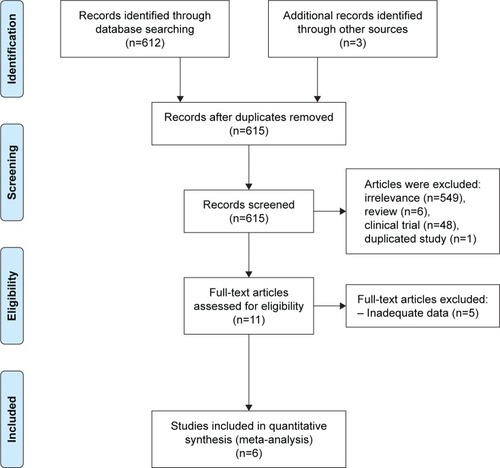
Table 1 Characteristics of the six selected articles
Figure 2 Forest plot of the prevalence of poststroke depression in Iranian patients.
Notes: The 95% CI for each study is shown in the form of horizontal lines around the central mean, the midpoint of the dotted line represents the mean of the overall score, and the lozenge shape shows the CI of the prevalence of this disorder. Weights are from random-effects analysis.
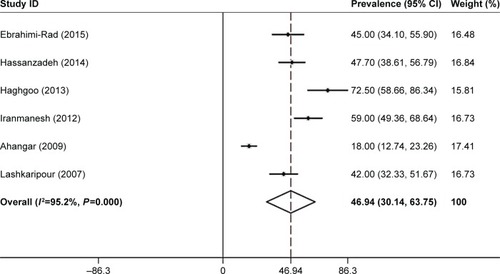
Figure 3 Forest plot of the prevalence of poststroke depression based on gender.
Note: Weights are from random-effects analysis.
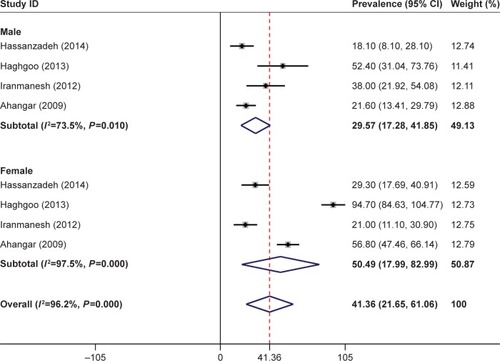
Figure 4 Meta-regression results for the prevalence of poststroke depression in the Iranian patients.
Notes: The prevalence of poststroke depression by the year of publication (A) and sample size (B). Circles indicate the weight of the studies.
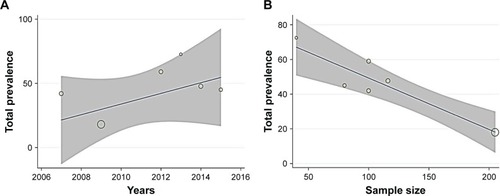
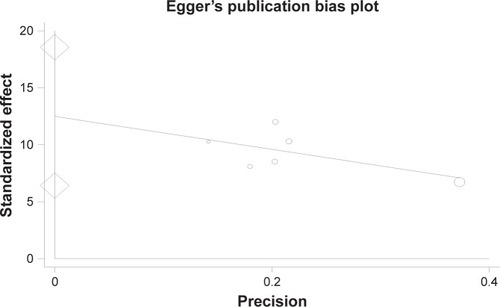
Figure 5 Publication bias.