Figures & data
Figure 1 Simple diagram of glutamate transport.
Notes: GLU released by vesicular exocytosis is uptaken from synaptic cleft by EAAT1, which is metabolized to GLN through the action of glutamate synthase. GLN then is transported back into neurons, converted to GLU through the action of glutaminase, and sequestered into synaptic vesicles by VGLUT1.
Abbreviations: EAAT1, excitatory amino acid transporter 1; GLN, glutamine; GLU, glutamate; VGLUT1, vesicular glutamate transporter 1.
Abbreviations: EAAT1, excitatory amino acid transporter 1; GLN, glutamine; GLU, glutamate; VGLUT1, vesicular glutamate transporter 1.
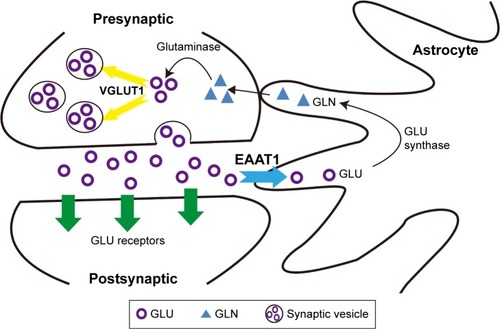
Figure 2 Comparison of stereotypy scores after treatment.
Notes: (A) A randomized screenshot from a complete video recording showing the stereotyped behavior of TS rats, which was assessed by two independent trained observers. (B) Comparison of stereotypy scores after JPZDD and Tia treatments (n=14). The 0 point on the x-axis represents the time of establishment of the TS model, while 1–6 points stand for the number of weeks of treatment. *P<0.05, Tia group vs model group; ∆P<0.05, JPZDD group vs model group.
Abbreviations: JPZDD, Jian-Pi-Zhi-Dong-Decoction; Tia, tiapride; TS, Tourette syndrome.
Abbreviations: JPZDD, Jian-Pi-Zhi-Dong-Decoction; Tia, tiapride; TS, Tourette syndrome.
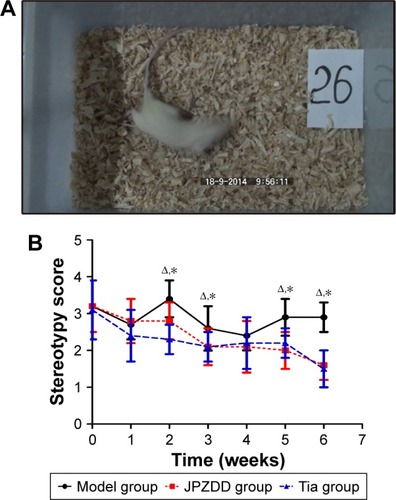
Figure 3 Comparison of autonomic activity after treatment.
Notes: (A) A randomized screenshot from one complete video data from two independent test boxes showing the evaluation process of autonomic activity in SD rats, in which the total distance of autonomic activity was recorded according to its movements. (B) Comparison of autonomic activity after JPZDD and Tia treatments (n=14). The 0 point on the x-axis stands for the time of establishment of the TS model, while 1–6 points stand for the number of weeks of treatment. P<0.05, control group vs model group; ∆P<0.05, JPZDD group vs model group; *P<0.05, Tia group vs model group.
Abbreviations: JPZDD, Jian-Pi-Zhi-Dong-Decoction; SD, Sprague Dawley; Tia, tiapride; TS, Tourette syndrome.
Abbreviations: JPZDD, Jian-Pi-Zhi-Dong-Decoction; SD, Sprague Dawley; Tia, tiapride; TS, Tourette syndrome.
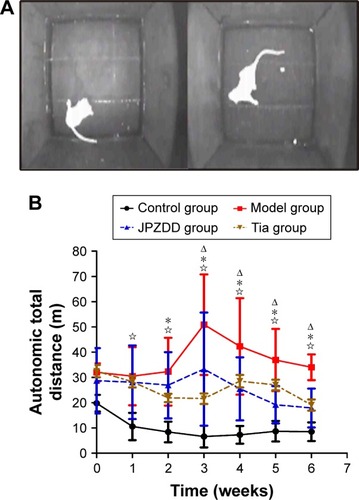
Figure 4 Comparison of GLU level in the striatum.
Notes: (A) HPLC analysis of amino acids in the striatum: GLU, Gln, Gly, Tau, and GABA appeared in that order. (B) Comparison of glutamate concentration in the striatum after JPZDD and Tia treatments (n=8). P<0.05, control group vs model group; #P<0.01, JPZDD or Tia group vs model group.
Abbreviations: FI, fluorescence intensity; GABA, γ-aminobutyric acid; Gln, glutamine; Gly, glycine; GLU, glutamate; HPLC, high-performance liquid chromatography; JPZDD, Jian-Pi-Zhi-Dong-Decoction; Tau, taurine; Tia, tiapride.
Abbreviations: FI, fluorescence intensity; GABA, γ-aminobutyric acid; Gln, glutamine; Gly, glycine; GLU, glutamate; HPLC, high-performance liquid chromatography; JPZDD, Jian-Pi-Zhi-Dong-Decoction; Tau, taurine; Tia, tiapride.
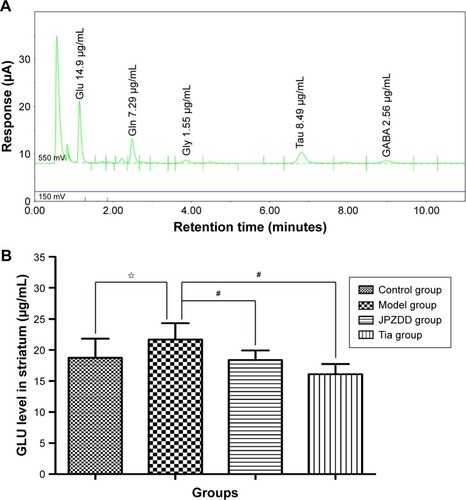
Figure 5 The expression of EAAT1 as determined by LSCM.
Notes: (A) Co-expression of EAAT1 and GFAP. (a) Positive EAAT1 staining with green fluorescence. (b) Glial cells labeled with GFAP (red fluorescence). (c) High co-expression of EAAT1 and glial cells showing a yellow color (white arrow) in a fixed region of interest (10×60 µm). (B) Expression of EAAT1 in the striatum after JPZDD and Tia treatment (n=6). Positive fluorescence of EAAT1 labeled with a green color. In the mixed picture, (a) to (d) represent the control, model, Tia, and JPZDD groups, respectively. P<0.05, control group vs model group; *P<0.05, JPZDD group or Tia group vs model group.
Abbreviations: EAAT1, excitatory amino acid transporter 1; FI, fluorescence intensity; JPZDD, Jian-Pi-Zhi-Dong-Decoction; LSCM, laser scanning confocal microscopy; Tia, tiapride.
Abbreviations: EAAT1, excitatory amino acid transporter 1; FI, fluorescence intensity; JPZDD, Jian-Pi-Zhi-Dong-Decoction; LSCM, laser scanning confocal microscopy; Tia, tiapride.
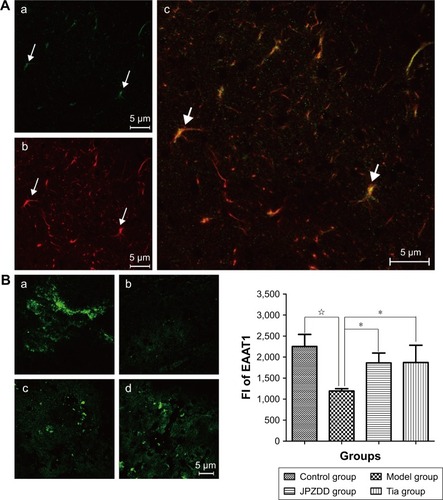
Figure 6 The expression of VGLUT1 as determined by LSCM.
Notes: (A) Co-expression of VGLUT1 and Tau46. (a) VGLUT1 expression showing a green fluorescence. (b) Axon cells labeled with Tau46 showing a red fluorescence. (c) Low co-expression of VGLUT1 with axon cells observed as a yellow color (white arrow) in a fixed region of interest (10×60 µm). (B) Expression of VGLUT1 in the striatum after JPZDD and Tia treatment (n=6). Positive fluorescence of VGLUT1 expression showing a green color. In the mixed picture, (a) to (d) stand for the control, model, Tia, and JPZDD groups, respectively. P<0.05, control group vs model group; *P<0.05, JPZDD group or Tia group vs model group.
Abbreviations: FI, fluorescence intensity; JPZDD, Jian-Pi-Zhi-Dong-Decoction; LSCM, laser scanning confocal microscopy; Tia, tiapride; VGLUT1, vesicular glutamate transporter 1.
Abbreviations: FI, fluorescence intensity; JPZDD, Jian-Pi-Zhi-Dong-Decoction; LSCM, laser scanning confocal microscopy; Tia, tiapride; VGLUT1, vesicular glutamate transporter 1.
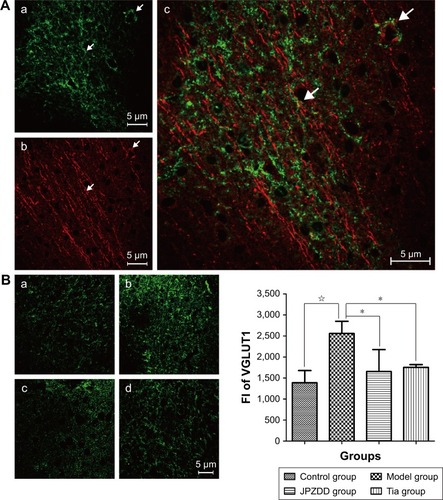
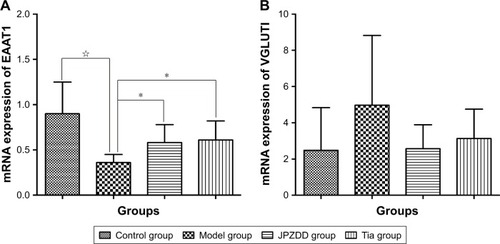
Figure 7 The mRNA expression of EAAT1 and VGLUT1 after treatment.
Notes: (A) Comparison of mRNA expression of EAAT1 after JPZDD and Tia treatments (n=8). (B) Comparison of mRNA expression of VGLUT1 after JPZDD and Tia treatments (n=8). P<0.05, control group vs model group; *P<0.05, JPZDD group or Tia group vs model group.
Abbreviations: EAAT1, excitatory amino acid transporter 1; JPZDD, Jian-Pi-Zhi-Dong-Decoction; Tia, tiapride; VGLUT1, vesicular glutamate transporter 1.
Abbreviations: EAAT1, excitatory amino acid transporter 1; JPZDD, Jian-Pi-Zhi-Dong-Decoction; Tia, tiapride; VGLUT1, vesicular glutamate transporter 1.