Figures & data
Table 1 Scale for quality evaluation
Figure 1 Flow diagram of the study selection process.
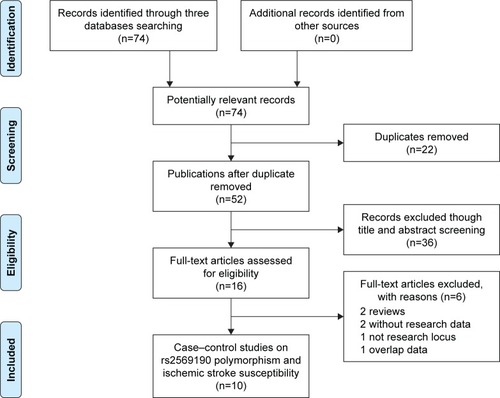
Table 2 Characteristics of case–control studies on CD14 rs2569190 C>T polymorphism and ischemic stroke risk
Figure 2 OR and 95% CIs of the associations between CD14 rs2569190 C>T polymorphism and ischemic stroke susceptibility in T vs C model.
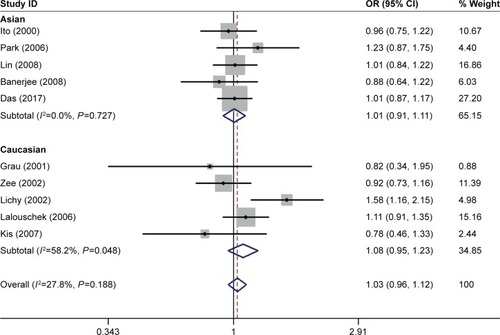
Table 3 Summary of ORs and 95% CI of CD14 rs2569190 C>T polymorphism and ischemic stroke risk
Figure 3 Cumulative meta-analyses according to publication year in T vs C model of CD14 rs2569190 C>T polymorphism.
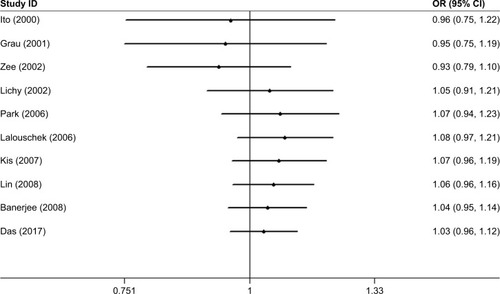
Figure 4 Sensitivity analysis through deleting each study to reflect the influence of the individual dataset to the pooled ORs in T vs C model of CD14 rs2569190 C>T polymorphism.
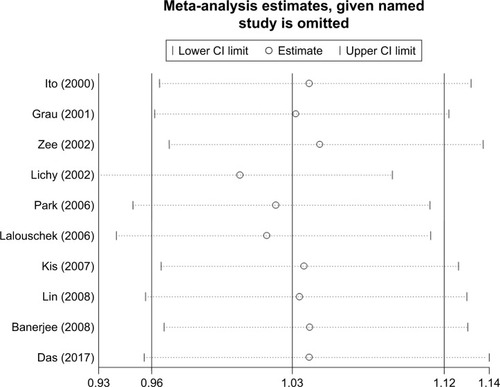
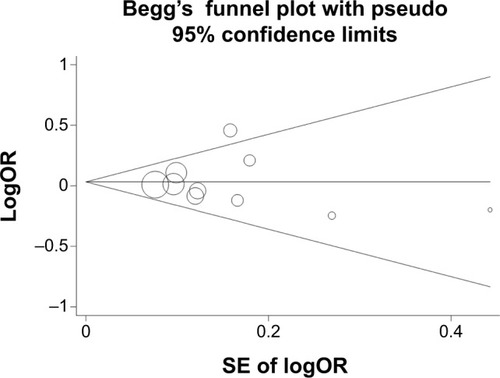
Figure 5 Funnel plot analysis to detect publication bias for T vs C model of CD14 rs2569190 C>T polymorphism.