
Figures & data
Figure 1 Behavioral observation of the cynomolgus monkeys. (A) Cynomolgus monkeys in a realistic social context. (B) Slumped or collapsed posture of a NOD macaque (red arrow). (C) A CON macaque. (D) The significant differential behavioral results between NOD macaques (n=10) and CON macaques (n=12).
Abbreviations: CON, control; NOD, naturally occurring depressive; HC, healthy control.
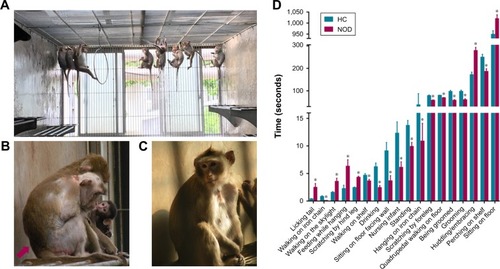
Table 1 Basic background data of NOD and CON macaques
Figure 2 An overview of the GC-MS-based metabonomic workflow identifying differentially expressed CSF metabolites in NOD macaques.
Abbreviations: CON, control; NOD, naturally occurring depressive; GC-MS, gas chromatography–mass spectrometry; CSF, cerebrospinal fluid; VIP, variable importance in the projection; IPA, Ingenuity Pathways Analysis.
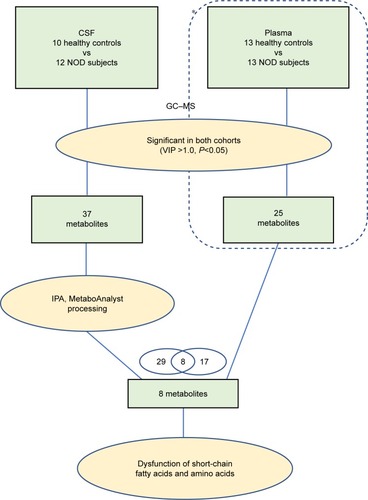
Figure 3 (A) Representative GC–MS total ion chromatograms (TIC) of the CON and NOD group. (B) Partial least squares-discriminate analysis (PLS-DA) scores plot derived from GC–MS spectra of the CON and NOD macaques.
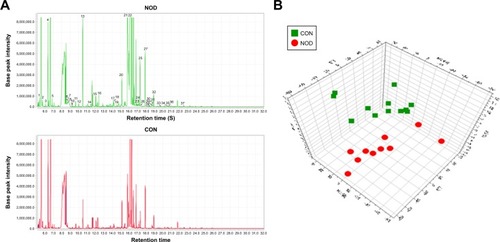
Figure 4 (A) Heat map of differentially expressed CSF metabolites in CON and NOD macaques. (B) Chemical taxonomy and (C) cellular locations based on the annotations of Human Metabolome Database (HMDB). The predicted biological functions were significantly involved in the biosynthesis of lipid (D) and uptake of amino acids (E).
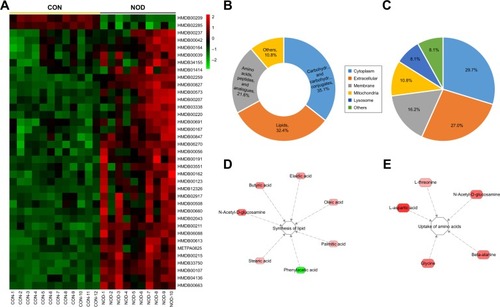
Table 2 Differential metabolites of cerebrospinal fluid (CSF) between NOD and CON macaques
Table 3 Top five affected ingenuity canonical pathways enriched in CSF between NOD and CON macaques
Figure 5 Network analysis of differentially expressed metabolites in CSF and serum of NOD macaques.
Abbreviations: NOD, naturally occurring depressive; CSF, cerebrospinal fluid; VIP, variable importance in the projection.
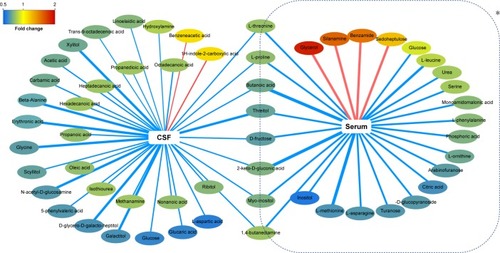
Table S1 The included behaviors of 12 behavior categories