
Figures & data
Table 1 The subjects profile
Figure 1 A model of subjective time in normal individuals.
Note: Time flows from the past to the present to the future.
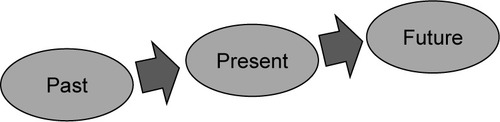
Figure 2 A model of subjective time in AD patients.
Notes: The subject alternates between awareness of the past and present and has difficulty imagining the passage of time to the future. The end (death) is imagined immediately after the future, giving the future a definite end.
Abbreviation: AD, Alzheimer’s disease.
Abbreviation: AD, Alzheimer’s disease.
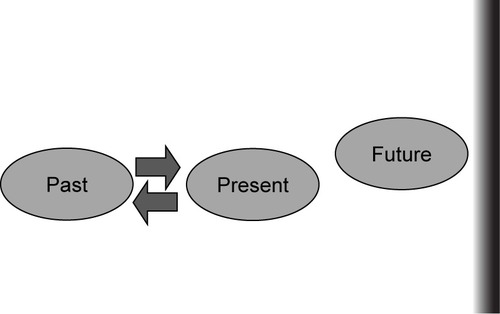
Table 2 Frequency of each category observed during individual subject interviews