Figures & data
Figure 1 Meta-analysis flow diagram of the study search strategy.
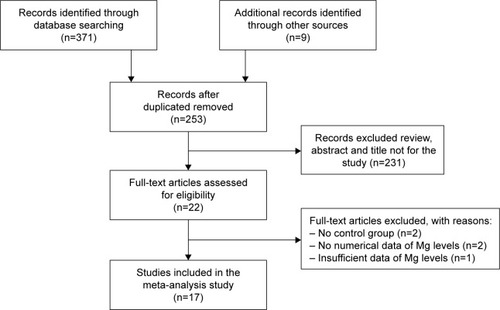
Table 1 Characteristics of the included studies in this meta-analysis (arranged by publication time)
Table 2 The subgroup analysis of studies reporting serum Mg levels in PD
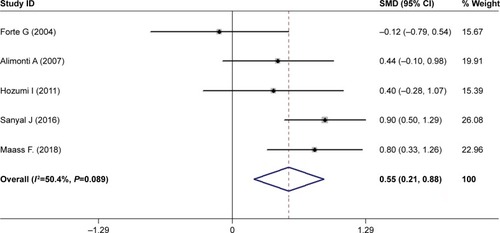
Figure 2 Forest plot of serum Mg levels between PD patients and HC subjects.
Notes: The horizontal lines represent 95% CI. The sizes of the shaded squares are proportional to study weight. Weights are from random-effects analysis.
Abbreviations: HC, healthy control; PD, Parkinson’s disease; SMD, standardized mean difference.
Abbreviations: HC, healthy control; PD, Parkinson’s disease; SMD, standardized mean difference.
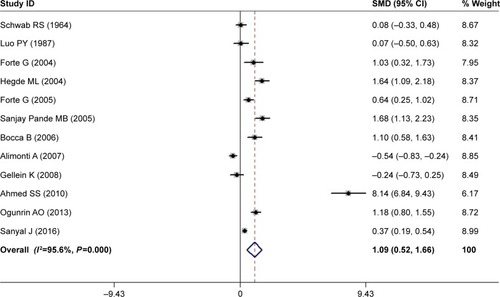
Table 3 The meta-regression of studies reporting serum Mg levels in PD
Figure 3 Forest plot of peripheral blood Mg levels between PD patients and HC subjects.
Notes: The horizontal lines represent 95% CI. The sizes of the shaded squares are proportional to study weight. Weights are from random-effects analysis.
Abbreviations: HC, healthy control; PD, Parkinson’s disease; SMD, standardized mean difference.
Abbreviations: HC, healthy control; PD, Parkinson’s disease; SMD, standardized mean difference.
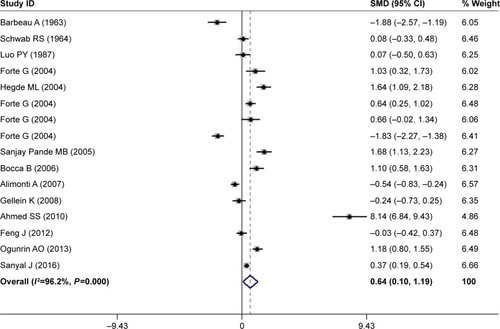
Table 4 The subgroup analysis of studies reporting peripheral blood Mg levels in PD
Table 5 The meta-regression of studies reporting peripheral blood Mg levels in PD
Figure 4 Forest plot of CSF Mg levels between PD patients and HC subjects.
Notes: The horizontal lines represent 95% CI. The sizes of the shaded squares are proportional to study weight. Weights are from random-effects analysis.
Abbreviations: CSF, cerebrospinal fluid; HC, healthy control; PD, Parkinson’s disease; SMD, standardized mean difference.
Abbreviations: CSF, cerebrospinal fluid; HC, healthy control; PD, Parkinson’s disease; SMD, standardized mean difference.