Figures & data
Table 1 Demographics and clinical measurements by group (mean ± SD)
Figure 1 The main effect of group on ALFF. The warm color represents a higher ALFF in PACG patients compared to NS, whereas the cool color represents a lower ALFF.
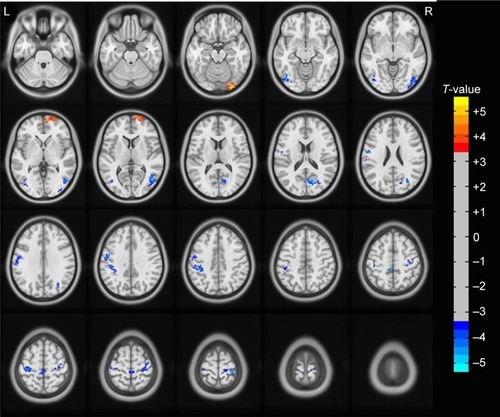
Table 2 The main effect of group on ALFF
Figure 2 The main effect for frequency band on ALFF. The warm color represents a higher ALFF in the slow-4 band compared to the slow-5 band, whereas the cool color represents a lower ALFF.
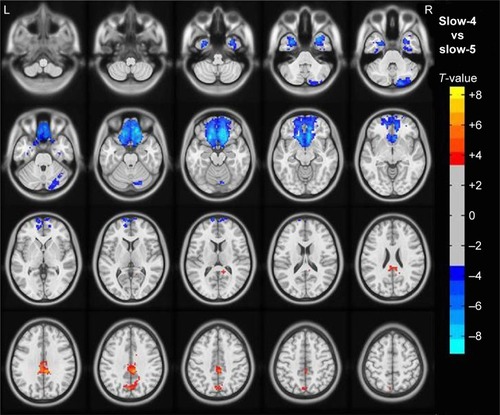
Table 3 The difference in ALFF between two frequency bands
Figure 3 The results are obtained on comparison of ALFF between PACG and NS groups in each frequency band (post hoc two-sample t-tests, voxel-level P <0.001, GRF corrected, cluster-level P <0.01).
Abbreviations: ALFF, amplitude of low-frequency fluctuation; GRF, Gaussian random field; IOG, inferior occipital gyrus; IPL, inferior parietal lobule; L, left; MOG, middle occipital gyrus; NS, normal-sighted controls; PACG, primary angle-closure glaucoma; postCG, postcentral gyrus; preCG, precentral gyrus; R, right.
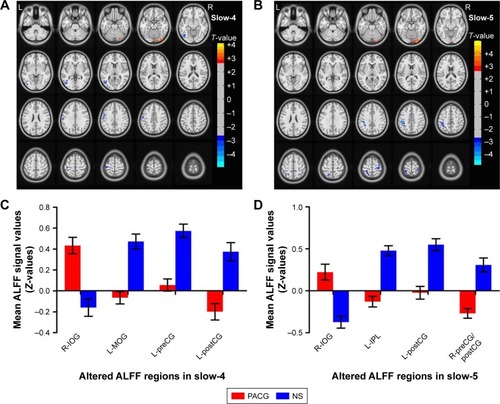
Table 4 The difference in ALFF in each frequency band between the two groups
Figure 4 ROC curve analysis of the mean ALFF in slow-4 and slow-5 bands for altered brain regions.
Abbreviations: ALFF, amplitude of low-frequency fluctuation; AUC, area under the curve; IOG, inferior occipital gyrus; IPL, inferior parietal lobule; L, left; MOG, middle occipital gyrus; NS, normal-sighted controls; PACG, primary angle-closure glaucoma; PreCG, precentral gyrus; PostCG, postcentral gyrus; R, right; ROC, receiver operating characteristic.
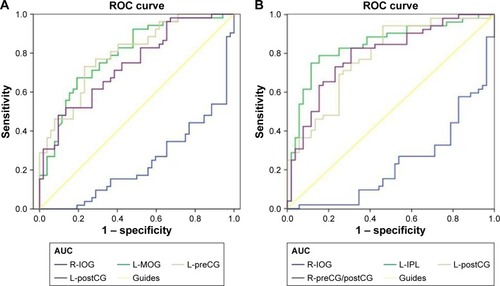
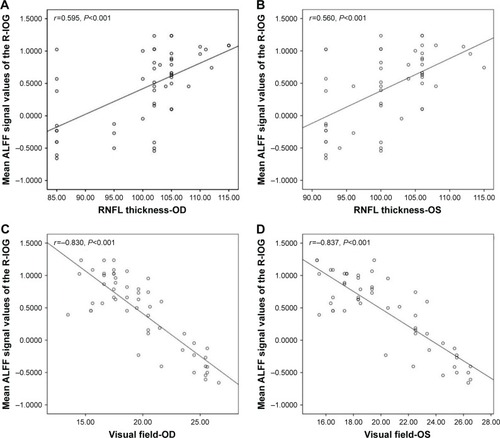
Figure 5 The correlations between the mean ALFF signal values of the different areas in slow-4 band and the behavioral performances.
Abbreviations: ALFF, amplitude of low-frequency fluctuation; IOG, inferior occipital gyrus; L, left; OD, oculus dexter; OS, oculus sinister; PACG, primary angle-closure glaucoma; R, right; RNFL, retinal nerve fiber layer; VF, visual field.