Figures & data
Table 1 Demographic and clinical characteristics
Figure 1 Alpha diversity of HC and MDD samples.
Notes: (A–D) The ACE, Chao1, Shannon, and Faith’s phylogenetic diversity of HC and MDD calculated using rarefied OTU matrix. All four diversity indices in HC are significantly higher than MDD. *P<0.05, **P<0.01, ***P<0.001.
Abbreviations: HC, healthly control; MDD, major depressive disorder; OTU, operational taxonomic unit.
Abbreviations: HC, healthly control; MDD, major depressive disorder; OTU, operational taxonomic unit.
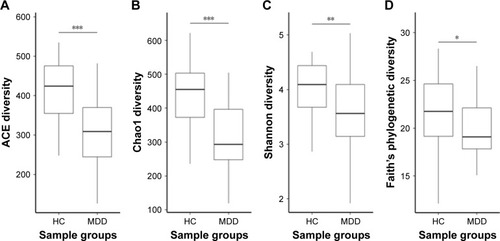
Figure 2 Beta diversity of HC and MDD.
Notes: (A and B) PCoA plot of unweighted Unifrac and weighted Unifrac distance of HC and MDD samples using rarefied OTU matrix. Green dots represent HC samples and red dots represent MDD samples.
Abbreviations: HC, healthly control; MDD, major depressive disorder; OTU, operational taxonomic unit; PCoA, principal coordinates analysis.
Abbreviations: HC, healthly control; MDD, major depressive disorder; OTU, operational taxonomic unit; PCoA, principal coordinates analysis.
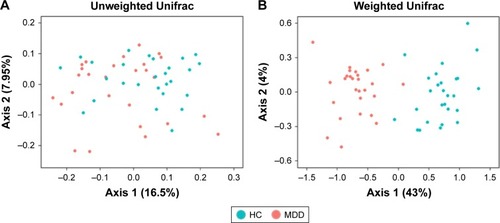
Figure 3 Taxa in phylum level of HC and MDD.
Notes: (A) The chart plot of taxa in HC and MDD samples. (B) The statistical test of Firmicutes relative abundance between HC and MDD samples. ***P<0.001.
Abbreviations: HC, healthly control; MDD, major depressive disorder.
Abbreviations: HC, healthly control; MDD, major depressive disorder.
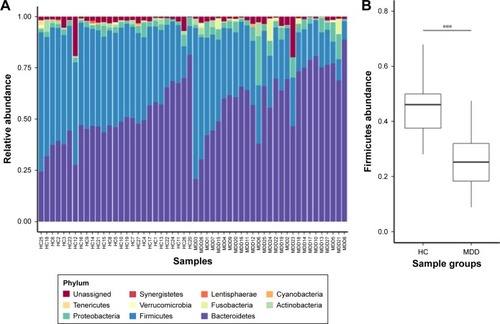
Figure 4 Taxonomic biomarkers in HC and MDD.
Notes: (A) Taxonomic biomarkers found by LEfSe in HC (green) and MDD (red). All taxa enriched in HC are from Firmicutes. (B) Cladogram plot of biomarkers. The size of node represents the abundance of taxa. Only taxa with P-value <0.01 and LDA score (log 10) >2 are shown.
Abbreviations: HC, healthly control; LEfSe, LDA effect size; MDD, major depressive disorder.
Abbreviations: HC, healthly control; LEfSe, LDA effect size; MDD, major depressive disorder.
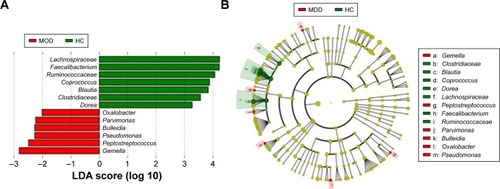
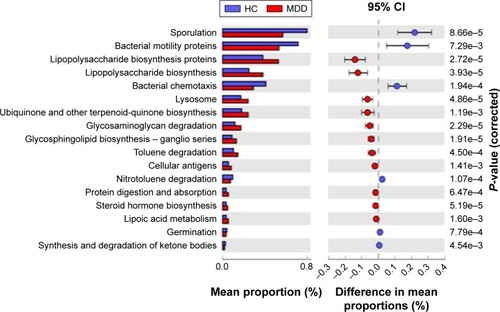
Figure 5 Predicted differential KEGG pathways in HC and MDD.
Notes: The extended error bar plot of significantly differential KEGG pathways predicted using PICRUSt. Only P-value <0.01 are shown.
Abbreviations: HC, healthly control; MDD, major depressive disorder.
Abbreviations: HC, healthly control; MDD, major depressive disorder.