
Figures & data
Figure 1 Study flow diagram.
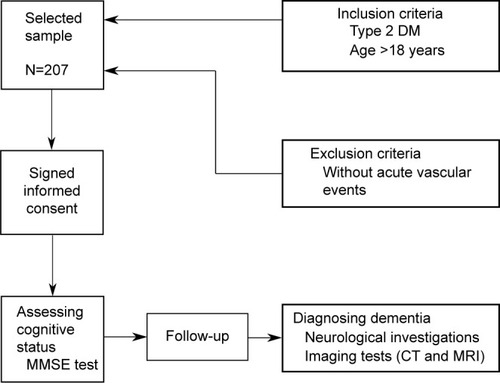
Table 1 Baseline characteristics of the patients
Table 2 Comparison between groups: DM patients without MCI vs DM patients with MCI
Table 3 Comparison between groups: DM patients with MCI who did not develop dementia vs DM patients with MCI who developed dementia
Figure 2 Multivariate risk analysis for developing dementia in T2DM patients with MCI. The risk is expressed per 1 percentage point increase for HbA1c, and 1 mg/dL point increase for fasting glycemia, postprandial glycemia, triglycerides, HDLc, and LDLc. For stroke events, and cardiovascular disease, the risk is expressed as dichotomous variables.
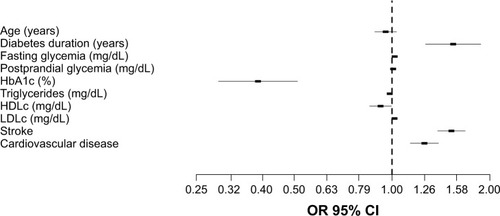
Table 4 Predictors of developing dementia in patients with DM and cognitive impairment (multivariate logistic regression model; Nagelkerke R2=0.689)