
Figures & data
Table 1 Demographics and pain characteristics in TA patients
Table 2 Demographics and behavioral results of TA and HC groups
Table 3 Brain regions with significant differences in ALFF between TA patients and HCs
Figure 1 Spontaneous brain activity in patients with toothache and HCs.
Abbreviations: ALFF, amplitude of low-frequency fluctuation; TA, toothache; HC, healthy control; LFG, left fusiform gyrus; LPG, left postcentral gyrus; RIOG, right inferior occipital gyrus; RSOG, right superior occipital gyrus; RLG, right lingual gyrus; RPL, right paracentral lobule.
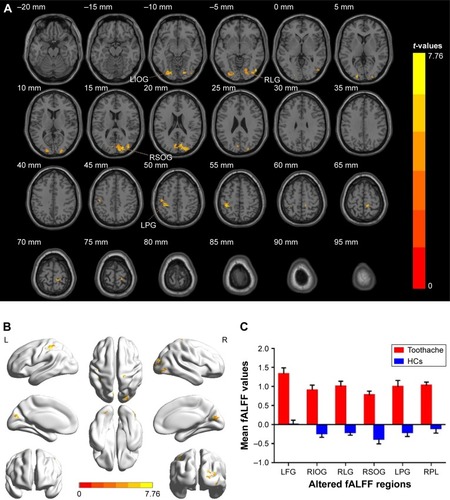
Figure 2 ROC curve analysis of the mean ALFF values for altered brain regions.
Abbreviations: ALFF, amplitude of low-frequency fluctuation; AUC, area under the curve; ROC, receiver operating characteristic; LFG, left fusiform gyrus; LPG, left postcentral gyrus; RIOG, right inferior occipital gyrus; RSOG, right superior occipital gyrus; RLG, right lingual gyrus; RPL, right paracentral lobule.
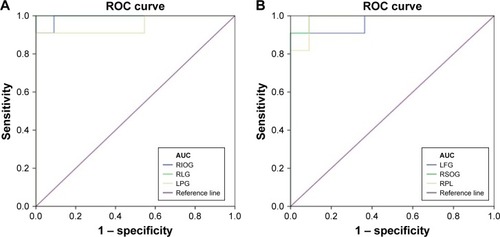
Figure 3 The ALFF results of brain activity in the TA group. (A) The VAS of the left eye positively correlated with ALFF signal values of the right paracentral lobule (r=0.639, P=0.025). (B) There is no correlation between the VAS and the right paracentral lobule.
Abbreviations: ALFF, amplitude of low-frequency fluctuation; TA, toothache; HC, healthy control; VAS, visual analog scale; BA, Brodman area.
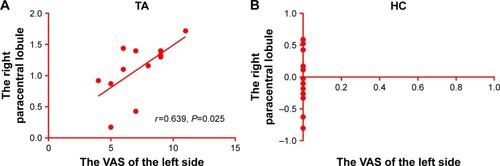
Figure 4 Correlations between mean ALFF signal values and behavioral performance.
Abbreviations: ALFF, amplitude of low-frequency fluctuation; VAS, visual analog scale.
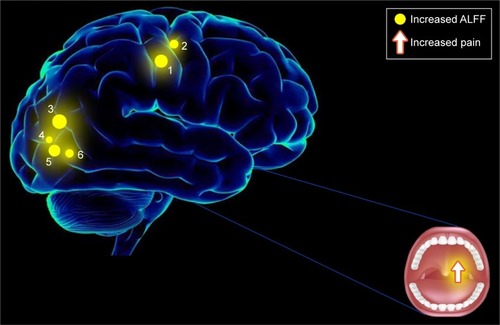
Table 4 ALFF method applied in pain-related diseases