
Figures & data
Table 1 Demographic and clinical characteristics of participants
Figure 1 Serum levels of BICC1 in patients with different types of mood disorders and HC.
Notes: Compared with HC: *PTukey <0.05 and **PTukey <0.001; compared with BD: &&PTukey <0.001; compared with BM: $$PTukey <0.001.
Abbreviations: BD, bipolar depression; BM, bipolar mania; HC, healthy controls; MDD, major depressive disorder.
Abbreviations: BD, bipolar depression; BM, bipolar mania; HC, healthy controls; MDD, major depressive disorder.
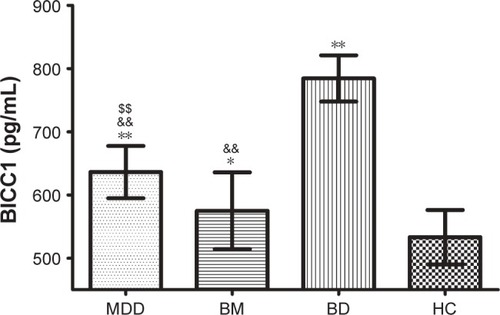
Figure 2 Diagnostic and differential powers of serum BICC1.
Note: ROC curves of BICC1 between: (A) MDD and HC, (B) BM and HC, (C) BD and HC, (D) MDD and BD, (E) BM and BD, and (F) MDD and BM.
Abbreviations: AUC, area under the curve; BD, bipolar depression; BM, bipolar mania; HC, healthy controls; MDD, major depressive disorder; ROC, receiver operating characteristic.
Abbreviations: AUC, area under the curve; BD, bipolar depression; BM, bipolar mania; HC, healthy controls; MDD, major depressive disorder; ROC, receiver operating characteristic.
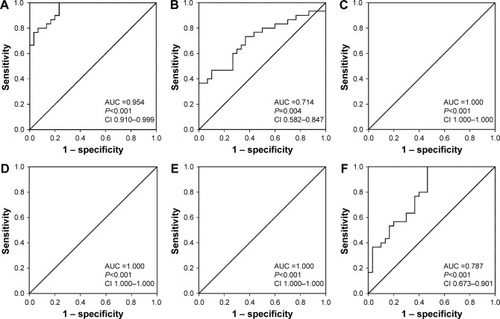
Table 2 Results of ROC curve analysis among these four groups