
Figures & data
Table 1 Summary of polymorphisms identified across analyses
Table 2 The effect of diagnosis on FA values (HS > MDD patients)
Figure 1 A comparison of FA findings between MDD patients and HS.
Note: Axial slices of the cohort’s mean FA skeleton (green) overlaid with red clusters depicting significantly lower FA values (left ATR, IFOF, CST, UF, and forceps minor) in the MDD patients compared to that in HS (FWE-corrected P<0.05).
Abbreviations: ATR, anterior thalamic radiation; CST, corticospinal tract; FA, fractional anisotropy; FWE, family-wise error; HS, healthy subjects; IFOF, inferior fronto-occipital fasciculus; lt., left; MDD, major depressive disorder; UF, uncinate fasciculus.
Abbreviations: ATR, anterior thalamic radiation; CST, corticospinal tract; FA, fractional anisotropy; FWE, family-wise error; HS, healthy subjects; IFOF, inferior fronto-occipital fasciculus; lt., left; MDD, major depressive disorder; UF, uncinate fasciculus.
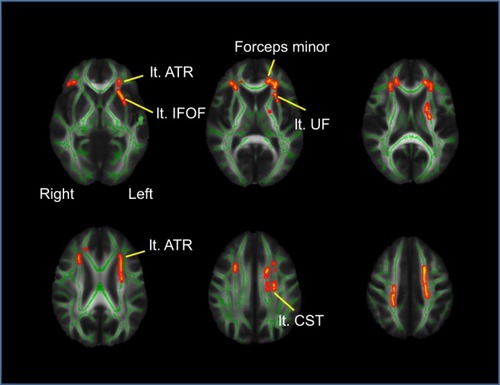
Figure 2 A comparison of FA findings between T/T individuals (rs301806) and C-carrier individuals with MDD.
Note: Axial slices of the cohort’s mean FA skeleton (green) overlaid with red clusters depicting significantly lower FA values (bilateral IFOF, bilateral ILF, right SLF, and forceps major) in T/T individuals with MDD compared to that in C-carrier individuals with MDD (FWE-corrected P<0.05).
Abbreviations: FA, fractional anisotropy; FWE, family-wise error; IFOF, inferior fronto-occipital fasciculus; ILF, inferior longitudinal fasciculus; lt., left; MDD, major depressive disorder; rt, right; SLF, inferior longitudinal fasciculus.
Abbreviations: FA, fractional anisotropy; FWE, family-wise error; IFOF, inferior fronto-occipital fasciculus; ILF, inferior longitudinal fasciculus; lt., left; MDD, major depressive disorder; rt, right; SLF, inferior longitudinal fasciculus.
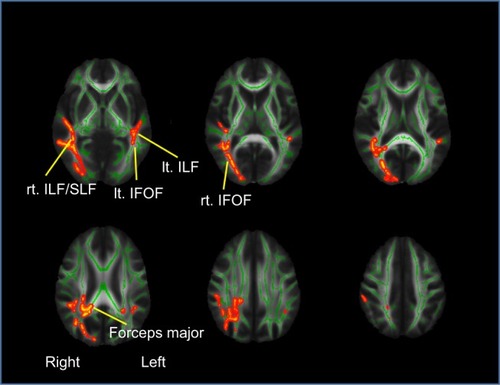
Table 3 The effect of genotype (rs301806) on FA values in MDD (C-carrier individuals > T/T individuals)
Table 4 Demographic and clinical characteristics among four groups regarding the rs301806 SNP
Figure 3 Genotype–diagnosis interactions.
Note: Axial slices of the cohort’s mean FA skeleton (green) overlaid with red clusters depicting a significant genotype–diagnosis interaction in which the lower FA values (left ATR and cingulum, bilateral CST, IFOF, ILF, SLF, UF, forceps major, and forceps minor) in MDD patients compared to that in HS are significantly larger in T/T individuals than in C-carrier individuals (FWE-corrected P<0.05).
Abbreviations: ATR, anterior thalamic radiation; CST, corticospinal tract; FA, fractional anisotropy; FWE, family-wise error; HS, healthy subjects; IFOF, inferior fronto-occipital fasciculus; ILF, inferior longitudinal fasciculus; lt., left; MDD, major depressive disorder; rt., right; SLF, inferior longitudinal fasciculus; UF, uncinate fasciculus.
Abbreviations: ATR, anterior thalamic radiation; CST, corticospinal tract; FA, fractional anisotropy; FWE, family-wise error; HS, healthy subjects; IFOF, inferior fronto-occipital fasciculus; ILF, inferior longitudinal fasciculus; lt., left; MDD, major depressive disorder; rt., right; SLF, inferior longitudinal fasciculus; UF, uncinate fasciculus.
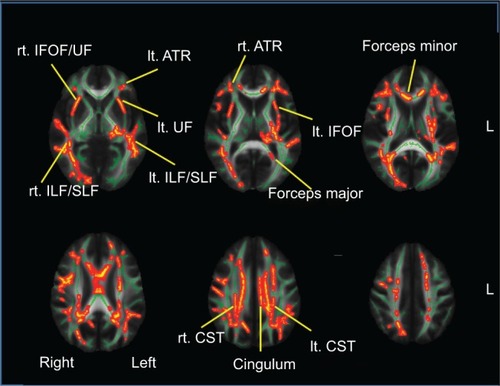
Table 5 The genotype–diagnosis interaction on FA values (rs301806: C-carrier individuals > T/T individuals)