Figures & data
Table 1 Baseline characteristics according to the prevalence of DCI
Table 2 Logistic regression analysis according to the occurrence of DCI
Table 3 WBC count in predicting the occurrence of DCI
Table 4 CTP parameters in predicting the occurrence of DCI
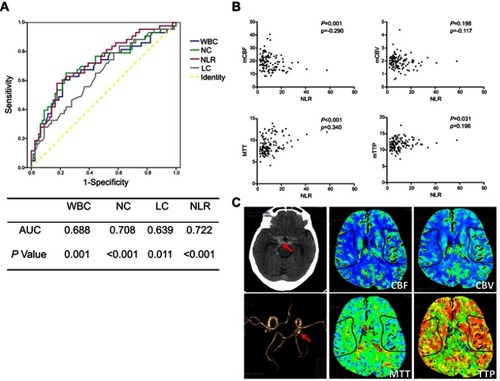
Figure 1 ROC analysis for the prediction of DCI and the correlation between NLR and CTP parameters. (A) The curve showed the predictive values of WBC, NC, LC, and NLR for the occurrence of DCI. The AUC of WBC, NC, LC, and NLR was 0.688 (P=0.001), 0.708 (P<0.001), 0.639 (P=0.011), and 0.722 (P<0.001), respectively. (B) NLR was significantly correlated with mCBF (ρ = −0.290, P=0.001), MTT (ρ =0.340, P<0.001), and mTTP (ρ =0.196, P=0.031). No correlation was found between NLR and mCBV (ρ =−0.117, P=0.198). (C) A case of aSAH diagnosed by brain CT scan. CTA showed a right PcomA aneurysm. CTP was performed 4 days after SAH showing a decrease of CBF and CBV and a prolonged MTT and TTP of the right hemisphere.
Abbreviations: ROC, receiver operating characteristic curve; DCI, delayed cerebral ischemia; WBC, white blood cell; NC, neutrophil count; LC, lymphocyte count; NLR, neutrophil-to-lymphocyte ratio; AUC, area under the curve; CBF, cerebral blood flow; CBV, cerebral blood volume; MTT, mean transit time; TTP, time to peak.