Figures & data
Figure 1 Study selection process in this meta-analysis.
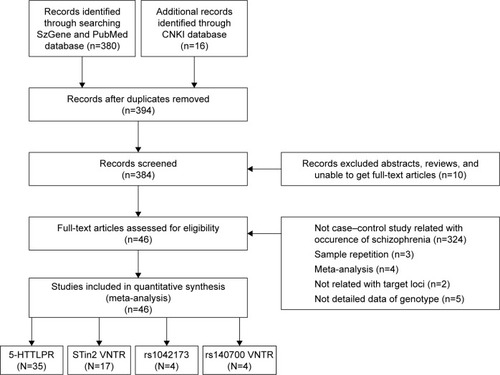
Table 1 Characteristics of the qualified studies in this meta-analysis
Table 2 Genotype distribution and allele frequency of 5-HTTLPR
Table 3 Pooled association of SLC6A4 polymorphisms with schizophrenia
Table 4 Subgroup association of SLC6A4 polymorphisms with schizophrenia
Table 5 Genotype distribution and allele frequency of STin2 VNTR
Table 6 Genotype distribution and allele frequency of rs1042173
Table 7 Genotype distribution and allele frequency of rs140700
Figure 2 Funnel plot analysis on the detection of publication bias in the association between 5-HTTLPR (SS + LS vs LL) and schizophrenia.
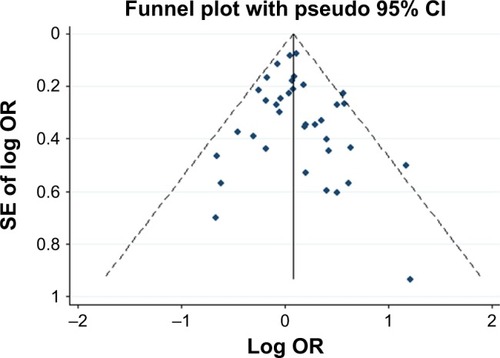
Figure 3 Funnel plot analysis on the detection of publication bias in the association between STin2 VNTR (10R/10R vs others) and schizophrenia.
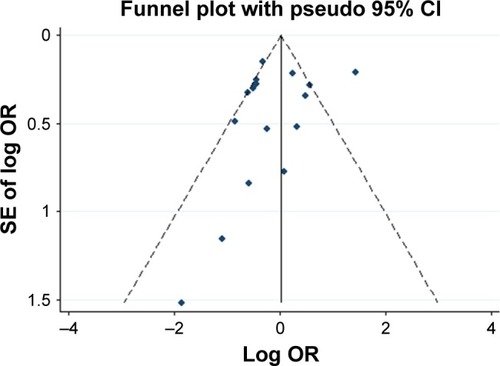
Figure 4 Funnel plot analysis on the detection of publication bias in the association between STin2 VNTR (10R/12R vs others) and schizophrenia.
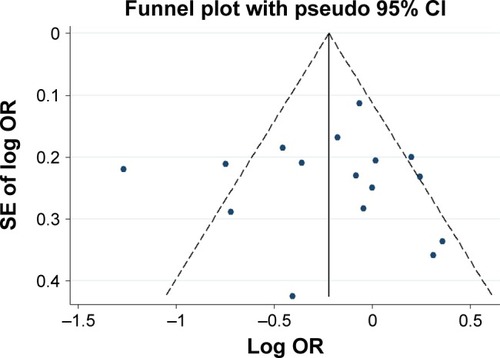
Figure 5 Funnel plot analysis on the detection of publication bias in the association between STin2 VNTR (12R/12R vs others) and schizophrenia.
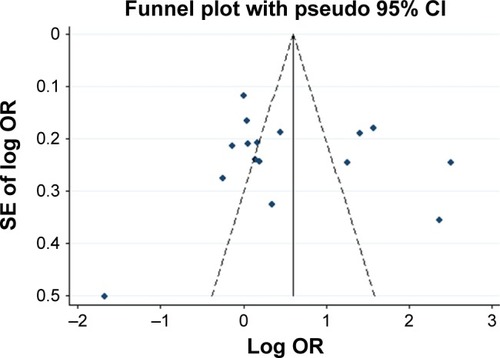
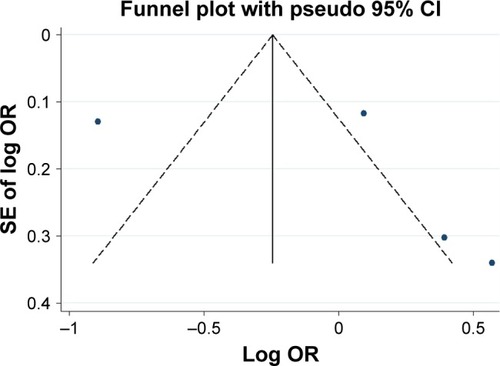
Figure 6 Funnel plot analysis on the detection of publication bias in the association between rs1042173 (GG vs GT + TT) and schizophrenia.
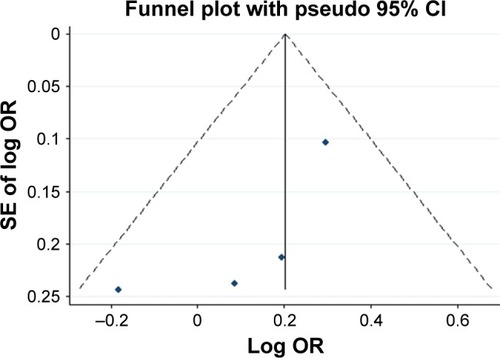
Figure 7 Funnel plot analysis on the detection of publication bias in the association between rs140700 (AA + AG vs GG) and schizophrenia.