
Figures & data
Table 1 Characteristics of included studies
Figure 1 PRISMA flow chart of studies included and excluded.
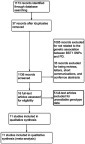
Table 2 The association between BST1 polymorphisms and Parkinson’s disease
Figure 2 Forest plots of odds ratios for the association between BST1 rs11931532 and PD. (A) allelic model; (B) dominant model; (C) recessive model.
Abbreviation: PD, Parkinson’s disease.
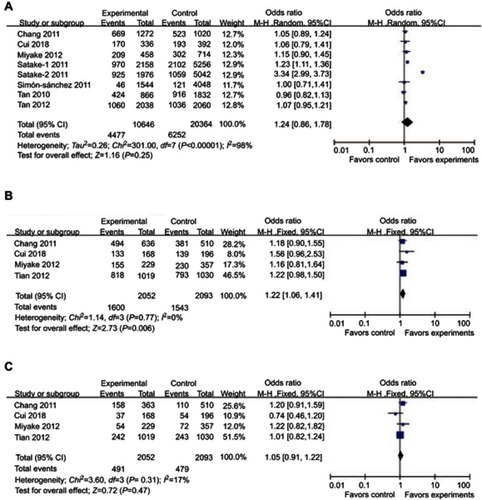
Figure 3 Forest plots of odds ratios for the association between BST1 rs4698412 and PD. (A) allelic model; (B) dominant model; (C) recessive model.
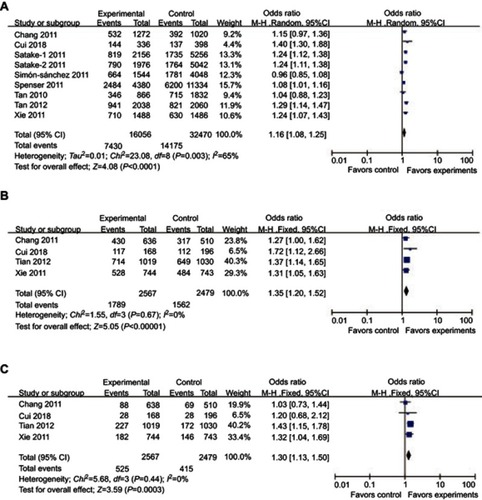
Figure 4 Forest plots of odds ratios for the association between BST1 rs11724635 and PD. (A) allelic model; (B) dominant model; (C) recessive model.
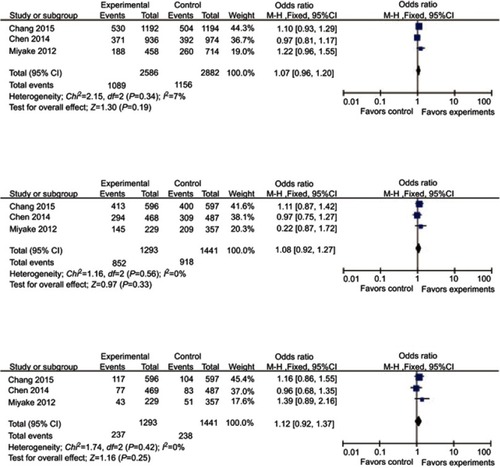
Figure 5 Sensitivity analyses between allelic models of BST1 rs11931532, rs4698412, rs11724635, and PD. (A) rs11931532; (B) rs4698412; (C) rs11724635.
Abbreviation: PD, Parkinson’s disease.
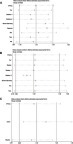
Figure 6 Publication bias of literatures for BST1 rs11931532, rs4698412, and rs11724635 were tested by Begg’ s funnel plot and Egger’ s test. (A) rs11931532; (B) rs4698412; (C) rs11724635.
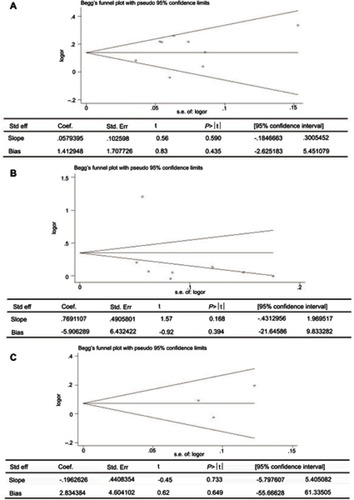
Table S1 Methodological quality of the included studies according to the Newcastle-Ottawa scale