Figures & data
Figure 1 Experimental paradigm.
Notes: Different voices are presented from left and right headphones. There were three conditions (1, negative word to the right ear and neutral word to the left ear; 2, neutral word to the right ear and negative word to the left ear; 3, neutral words to both ears). At the beginning of the task, the participants were instructed to pay attention to the right ear or to the left ear. Next, the participants answered whether the word heard from the attended ear was the same as the word consecutively presented on the screen by pressing a button. After the red cross indicating that attention should be switched to the opposite ear was presented in the middle of the session, the participants switched their attention to the other side and conducted another half session.
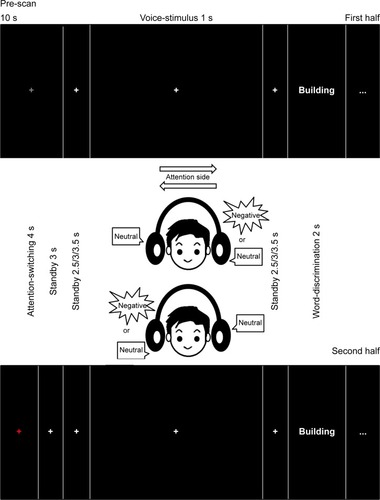
Table 1 Participant characteristics and symptom scores
Figure 2 Behavioral results.
Notes: The correct rate in the schizophrenia group was significantly worse than that in the healthy controls (P=0.002), but reaction times were not significantly different between the schizophrenia group and the control group.
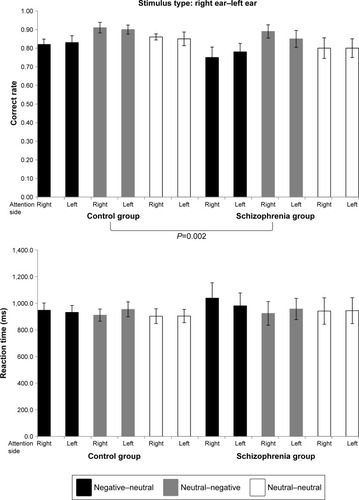
Table 2 Behavioral results
Figure 3 Functional magnetic resonance imaging results.
Notes: Significant interaction of group and stimulus type was observed in the right pars triangularis of the inferior frontal gyrus (P<0.05, false discovery rate-corrected) (left image). When negative words were presented to the right ear and neutral words were presented to the left ear, activity in this region was significantly reduced in the schizophrenia group compared to that in the control group (P=0.01). When neutral words were presented to the right ear and negative words were presented to the left ear, activity in this region was significantly elevated in the schizophrenia group compared to that in the control group. (P<0.01) (right image).
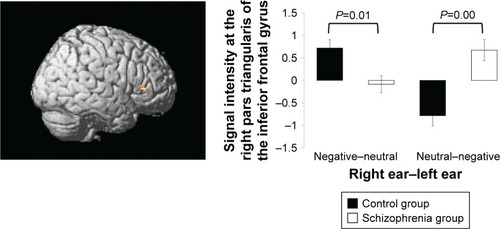
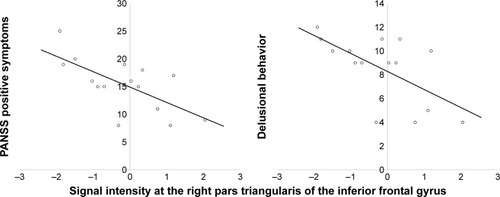
Figure 4 Relationships between signal intensity and positive symptoms and delusional behavior.
Notes: Scatter plots depict correlations between the signal intensity of negative–neutral-minus-neutral–neutral activity irrespective of attention side and severity of positive symptoms in the PANSS (r=−0.67, P=0.006) and delusional behavior (r=−0.62, P=0.014).
Abbreviation: PANSS, Positive and Negative Syndrome Scale.
Abbreviation: PANSS, Positive and Negative Syndrome Scale.