Figures & data
Table 1 Demographic data of the MDD patients and healthy controls
Table 2 Relations between HAM-DI7 sub-items scores and IL-6, MHPG, or HVA
Table 3 Comparison of IL-6 between the MDD patients and HC
Table 4 The raw correlations among the biological measures
Table 5 The adjusted correlations among the biological measures
Table 6 Calculated power for three biomarkers
Figure 1 Dot plot of IL-6 between MDD and HC (P=0.00096).
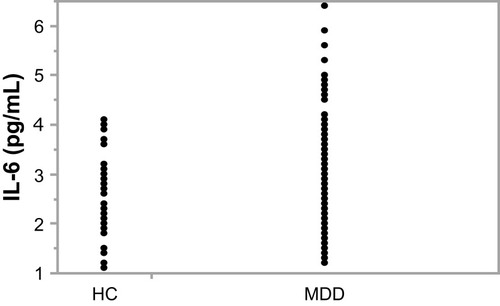
Figure 2 Partial regression residual leverage plot of plasma IL-6 levels and HAM-D17 scores (P<0.0001, RCitation2=0.33).
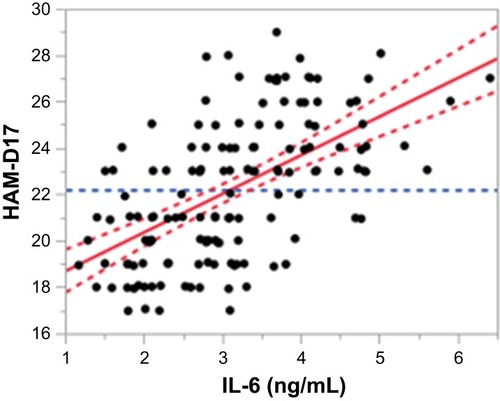
Figure 3 Partial regression residual leverage plot of plasma MHPGlevels and HAM-D17 scores (P=0.8630).
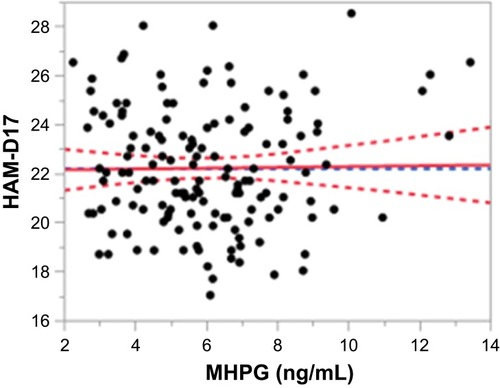
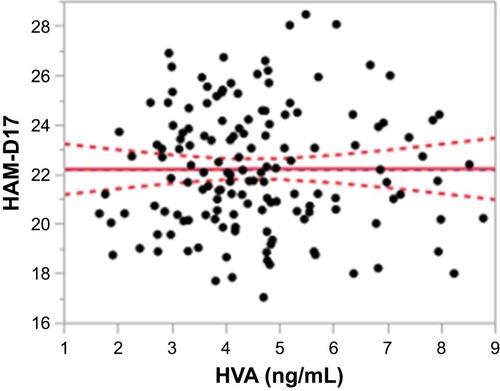
Figure 4 Partial regression residual leverage plot of plasma HVAlevels and HAM-D17 scores (P=0.9860).