
Figures & data
Table 1 Participant flow
Table 2 Study population
Figure 1 Prevalence of cognitive symptoms (PDQ-D total score ≥21).
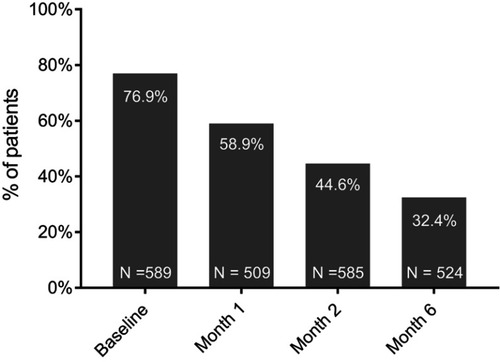
Figure 2 Study assessment across study months. Error bars represent 95% confidence intervals. Baseline: (A) PDQ-D, n=589; (B) DSST, n=598; (C) HAM-D17, n=598; (D) SDS, n=455; (E) WPAI-SHP absenteeism, n=313; presenteeism, n=278; overall work impairment, n=278; activity impairment, n=597; (F) EQ-5D, n=596. Month 6: PDQ-D, n=524; DSST, n=526; HAM-D17, =530; WPAI-SHP absenteeism, n=286; presenteeism, n=272; overall work impairment, n=271; activity impairment, n=529; SDS, n=434; EQ-5D, n=525.
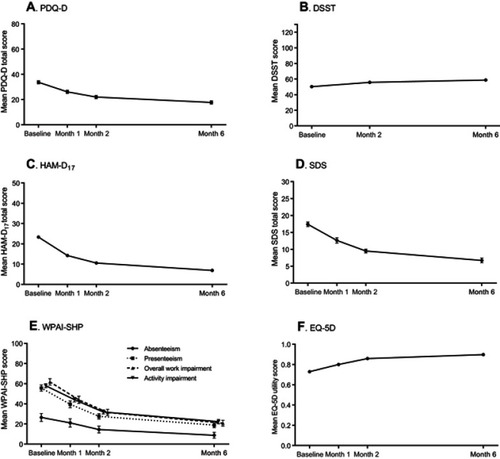
Table 3 Baseline correlations among assessments of cognition, mood, and functioning
Figure 3 Associations between cognitive symptoms (PDQ-D total score)/cognitive performance (DSST score) and clinical outcomes. Reference categories (grey symbols): Lowest PDQ quartile/DSST score within norm. Logistic regression based on stepwise backward model selection with age, gender, region, HAM-D17, and PDQ-D/DSST scores as forced factors. Note that Y-axis displays the log-scale (data have not been log-transformed). Error bars represent 95% confidence intervals. P-values based on tests for global differences. PDQ-D quartiles at baseline: 0–20, n=136; 21–32, n=158; 33–43, n=137; 44–80, n=158. PDQ-D quartiles at month 2: 0–9, n=135; 10–17, n=155; 18–30, n=140; 31–80, n=155. DSST categories at baseline: Within norm, n=265; 1/3 to 2/3 SD below norm, n=80; 2/3 to 1 SD below norm, n=72; ≥1 SD below norm, n=181. DSST categories at month 2: Within norm, n=360; 1/3 to 2/3 SD below norm, n=74; 2/3 to 1 SD below norm, n=53; ≥1 SD below norm, n=111. Response defined as a reduction of >50% from baseline in HAM-D17 total score. Remission defined as HAM-D17 total score ≤7. Relapse: “yes” if patients had a PHQ-9 total score ≤9 points at month 2 but worsened to a PHQ-9 total score ≥10 points at month 6, and “no” if PHQ-9 total score ≤9 points both at month 2 and month 6 [for replacement of missing values, see Supplementary materials].
![Figure 3 Associations between cognitive symptoms (PDQ-D total score)/cognitive performance (DSST score) and clinical outcomes. Reference categories (grey symbols): Lowest PDQ quartile/DSST score within norm. Logistic regression based on stepwise backward model selection with age, gender, region, HAM-D17, and PDQ-D/DSST scores as forced factors. Note that Y-axis displays the log-scale (data have not been log-transformed). Error bars represent 95% confidence intervals. P-values based on tests for global differences. PDQ-D quartiles at baseline: 0–20, n=136; 21–32, n=158; 33–43, n=137; 44–80, n=158. PDQ-D quartiles at month 2: 0–9, n=135; 10–17, n=155; 18–30, n=140; 31–80, n=155. DSST categories at baseline: Within norm, n=265; 1/3 to 2/3 SD below norm, n=80; 2/3 to 1 SD below norm, n=72; ≥1 SD below norm, n=181. DSST categories at month 2: Within norm, n=360; 1/3 to 2/3 SD below norm, n=74; 2/3 to 1 SD below norm, n=53; ≥1 SD below norm, n=111. Response defined as a reduction of >50% from baseline in HAM-D17 total score. Remission defined as HAM-D17 total score ≤7. Relapse: “yes” if patients had a PHQ-9 total score ≤9 points at month 2 but worsened to a PHQ-9 total score ≥10 points at month 6, and “no” if PHQ-9 total score ≤9 points both at month 2 and month 6 [for replacement of missing values, see Supplementary materials].](/cms/asset/3083531d-7189-4dbc-a5c7-777c980c1392/dndt_a_195505_f0003_b.jpg)
Table 4 Associations between PDQ-D total score/DSST score and functional outcomes at month 6
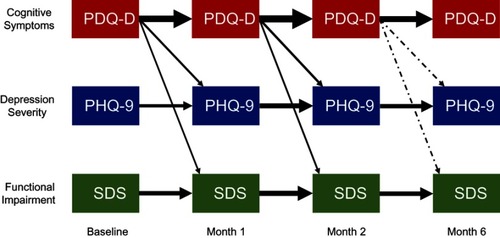
Figure 4 Temporal interdependencies among patient-reported measures of cognitive symptoms, patient-reported depressive symptoms, and functional impairment. Standardized regression coefficients based on the structural equation models (SEM) with p-values <0.05 (n=451). The thickness of arrows is proportional to the strength of association. A solid arrow indicates p-value <0.001; a dot-dashed arrow indicates p-value <0.05.
Data availability
The authors declare that the data supporting the findings of this study are available within the article. The authors may be contacted for further data sharing.