Figures & data
Table 1 Scale for quality evaluation
Table 2 Characteristics of case-control studies on ALDH2 rs671G>A polymorphism and ischemic stroke risk included in the meta-analysis
Figure 1 Flow diagram of the study selection process.
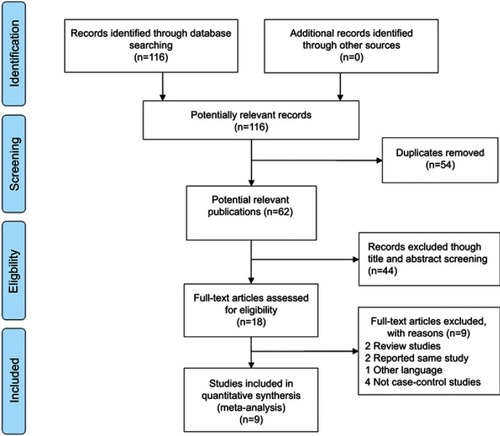
Table 3 Summary ORs and 95% CI of ALDH2 rs671G>A polymorphism and ischemic stroke risk
Figure 2 OR and 95% CIs of the associations between ALDH2 rs671G>A polymorphism and ischemic stroke risk in AA vs GG model.
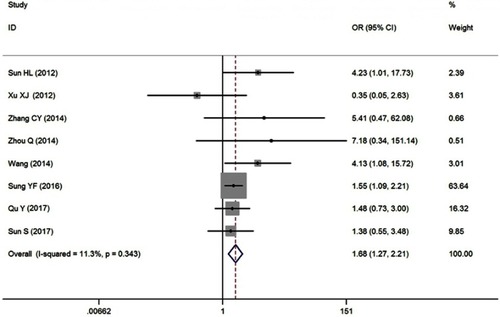
Figure 3 Cumulative meta-analyses according to publication year in AA vs GG model of ALDH2 rs671G>A polymorphism.
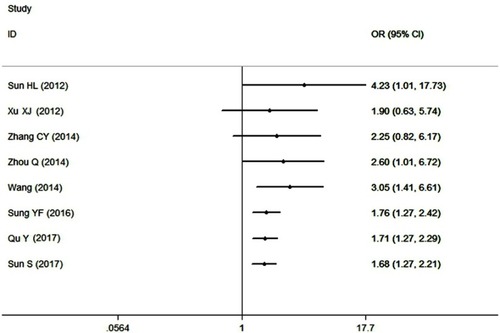
Figure 4 Sensitivity analysis involving deletion of each study to reflect the influence of the individual dataset to the pooled ORs in AA vs GG model of ALDH2 rs671G>A polymorphism.
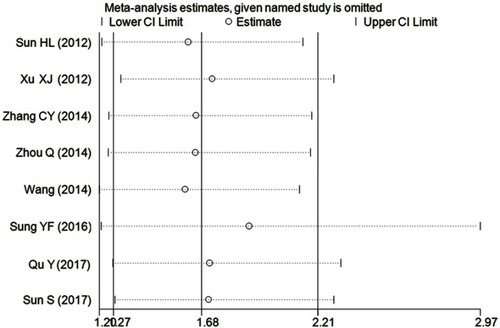
Figure 5 Funnel plot analysis to detect publication bias for AA vs GG model of ALDH2 rs671G>A polymorphism. Circles represent the weight of the studies.
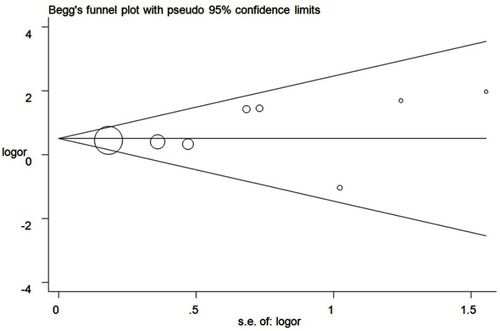
Figure S1 OR and 95% CIs of the associations between ALDH2 rs671G>A polymorphism and ischemic stroke risk (A for A vs G model; B for GA vs GG model; C for GA + AA vs GG model; D for AA vs GG + GA model).
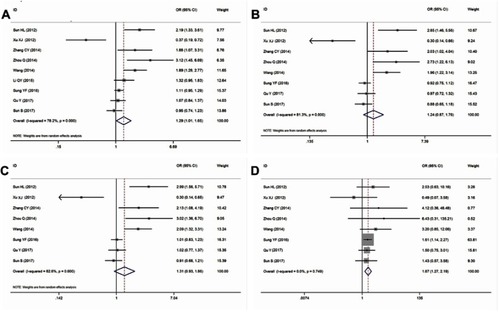
Figure S2 Cumulative meta-analyses according to publication year in ALDH2 rs671G>A polymorphism and ischemic stroke risk (A for A vs G model; B for GA vs GG model; C for GA + AA vs GG model; D for AA vs GG + GA model).
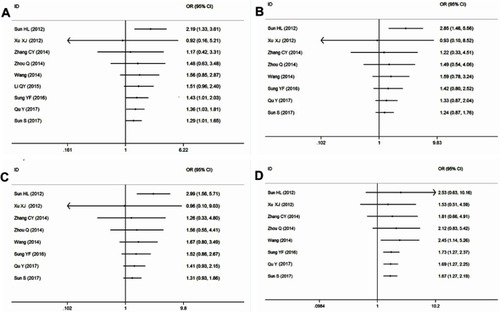
Figure S3 Sensitivity analysis through deleting each study to reflect the influence of the individual dataset to the pooled ORs in ALDH2 rs671G>A polymorphism and ischemic stroke risk (A for A vs G model; B for GA vs GG model; C for GA + AA vs GG model; D for AA vs GG + GA model).
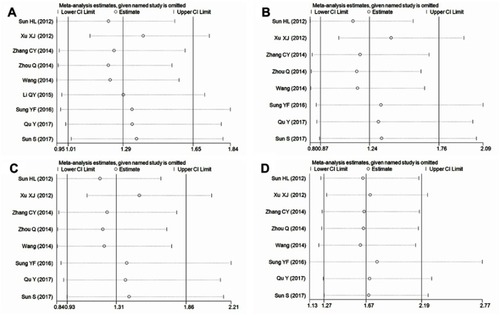
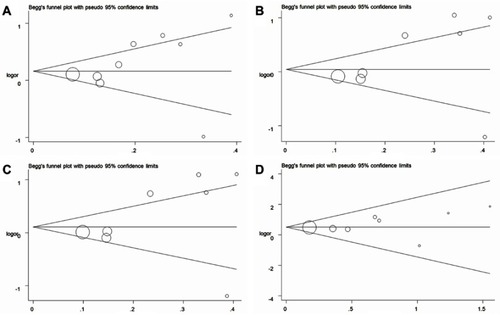
Figure S4 Funnel plot analysis to detect publication bias in ALDH2 rs671G>A polymorphism (A for A vs G model; B for GA vs GG model; C for GA + AA vs GG model; D for AA vs GG + GA model). Circles represent the weight of the studies.