Figures & data
Table 1 Baseline demographic characteristics and clinical features of participants with treatment-resistant depression receiving TAU with or without adjunctive VNS + TAU (two-sided t-test P-value for continuous data and asymptotic normal test P-value for categorical data)
Table 2 Kaplan–Meier probability estimates with 95% CI
Figure 1 A Kaplan–Meier plot demonstrates time to first response among 328 participants in the VNS + TAU group and 271 participants in the TAU group.
Abbreviations: MADRS, Montgomery–Åsberg Depression Rating Scale; TAU, treatment as usual; VNS, vagus nerve stimulation.
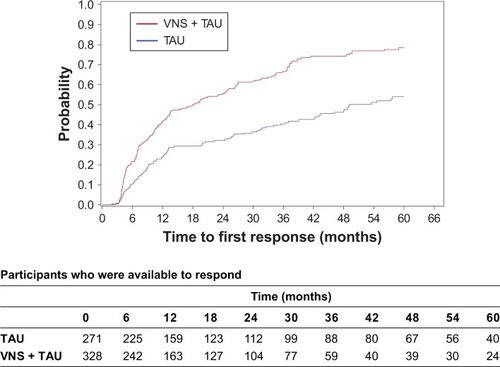
Figure 2 A Kaplan–Meier plot for durability of the first response that occurred within the first year.
Abbreviations: MADRS, Montgomery–Åsberg Depression Rating Scale; TAU, treatment as usual; VNS, vagus nerve stimulation.
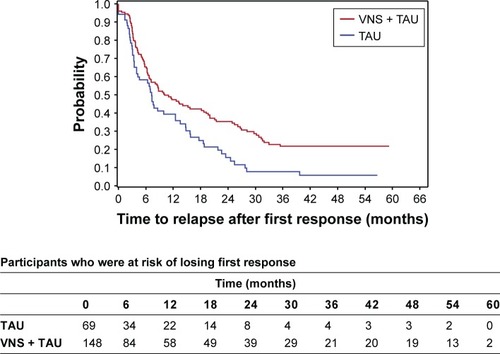
Figure 3 A Kaplan–Meier plot for durability of first response in the first year for VNS + TAU participants by visit.
Abbreviations: TAU, treatment as usual; VNS, vagus nerve stimulation.
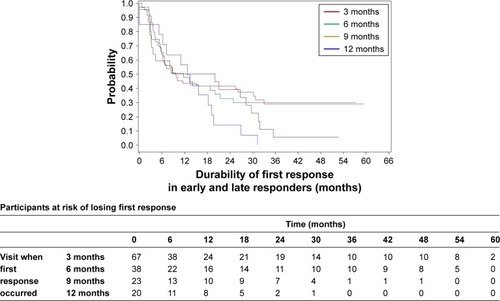
Figure S1 A Kaplan–Meier plot for durability of first response in the first year for VNS + TAU participants by early and late responder.
Note: The trend in the probability of retaining the first response beyond 1 year was higher in the early responder group (ie, first response at 3 or 6 months after VNS initiation) compared with the late responder group (ie, first response at 9 or 12 months after VNS initiation).
Abbreviations: TAU, treatment as usual; VNS, vagus nerve stimulation.
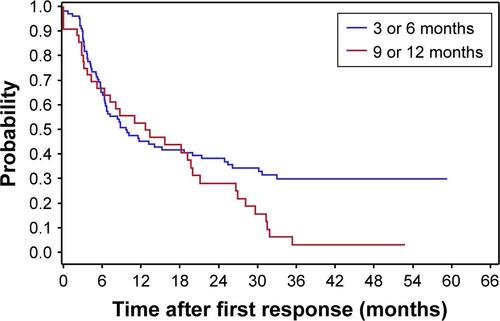
Figure S2 A Kaplan–Meier plot shows the chance of a second response after relapse following the first response within the first year in both VNS + TAU and TAU.
Abbreviations: TAU, treatment as usual; VNS, vagus nerve stimulation.
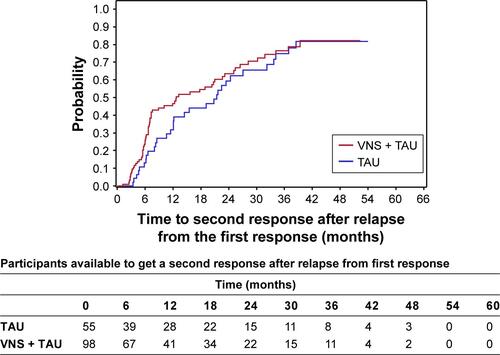
Figure S3 A Kaplan–Meier plot demonstrates that the second response may be more durable with VNS + TAU versus TAU.
Abbreviations: TAU, treatment as usual; VNS, vagus nerve stimulation.
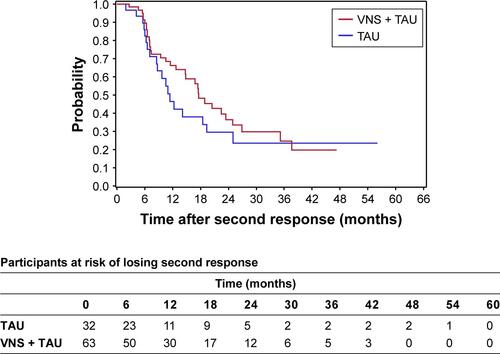
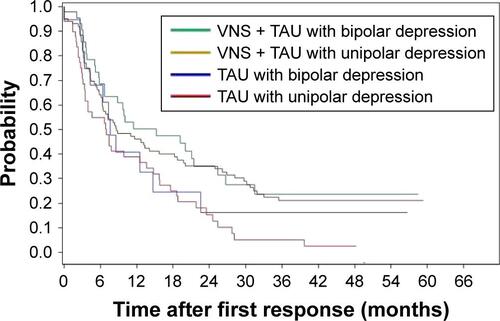
Figure S4 A Kaplan–Meier plot demonstrates that there was no difference in durability of the response in either treatment group based on the polarity of the depression.
Abbreviations: TAU, treatment as usual; VNS, vagus nerve stimulation.