
Figures & data
Figure 1 Voxel location: left frontal lobe (A), left temporal lobe (B), left thalamus (C), and 1H spectrum – raw and fitted data for each region.
Abbreviations: NAA, N-acetylaspartate; Glx, GABA, glutamine, glutamate; Cho, choline-containing compounds; Cr, creatine plus phosphocreatine; mI, myoinositol.
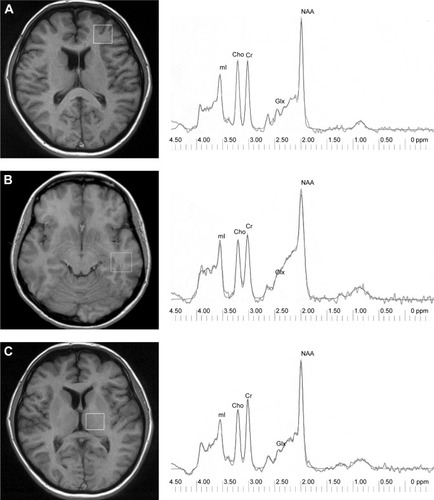
Table 1 Neurochemical findings in patients with schizophrenia during index hospitalization and at 5-year follow-up
Figure 2 Correlation between 5-year difference in frontal NAA levels and duration of last antipsychotic treatment (R=0.908, P=0.012).
Abbreviation: NAA, N-acetylaspartate.
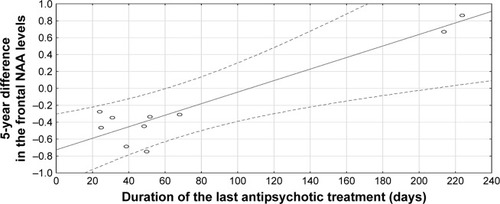
Table 2 Clinical and cognitive findings in patients with schizophrenia during index hospitalization and at 5-year follow-up