Figures & data
Table 1 Criteria for functional defects after surgery
Figure 1 Pathological morphology of rat brain tissue (×400) and expression of HO-1. (A) Pathological morphology of rat brain tissue; (B) Expression of HO-1, *p<0.05, compared with the sham group. #p<0.05, compared with the model group.
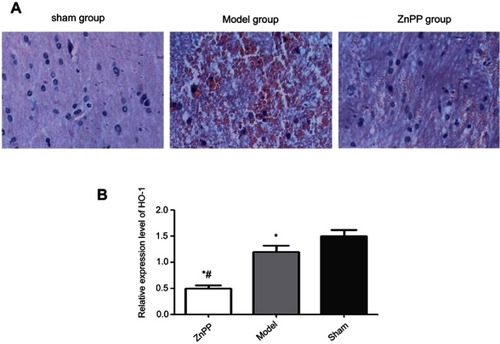
Figure 2 Comparison of neurological deficit scores in each group and Evans blue and brain water content. (A) Neurological deficit scores; (B) Evans blue content; (C) Brain water content. *p<0.05, compared with the sham group. #p<0.05, compared with the model group.
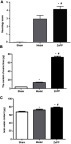
Figure 3 Effect of HO-1 inhibition on SOD and MDA levels in rats with cerebral hemorrhage (A) SOD; (B) MDA. *p<0.05, compared with the sham group. #p<0.05, compared with the model group.
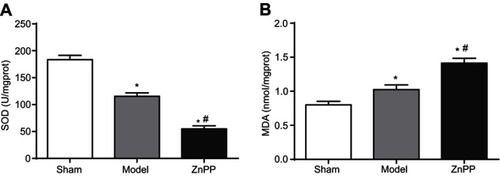
Figure 4 Changes of neuronal apoptosis in brain tissue of rats. *p<0.05, compared with the sham group. #p<0.05, compared with the model group. The positive cells were stained brown.
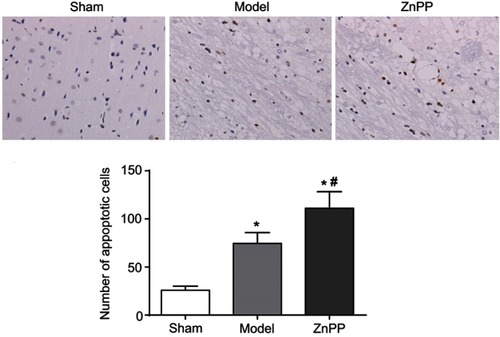
Figure 5 The expression of Bcl-2 and BAX protein in rat brain tissue (×400). (*p<0.05 when compared with the sham group. #p<0.05 when compared with the model group.). The positive cells were stained brown.
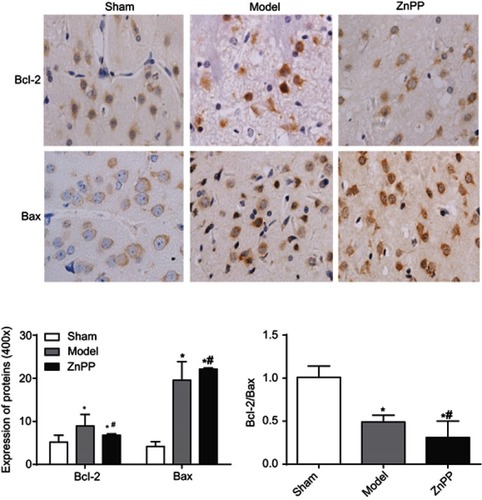
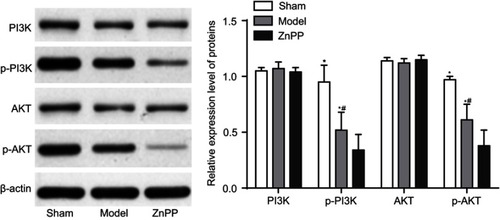
Figure 6 The expression of PI3K, AKT, p-PI3K and p-AKT protein in rat brain tissue. *p<0.05, compared with the sham group. #p<0.05, compared with the model group.