
Figures & data
Table 1 Demographic and clinical characteristics of all participants
Table 2 Regional GM volume differences in GI symptoms group, non-GI symptoms group and HCs group
Table 3 Regional GM volume differences between two groups
Table 4 The correlation between the regional GM volume and clinical characteristics
Figure 1 Regional GM volume differences in GI symptoms group, non-GI symptoms group and HCs group are displayed on axial, coronal and sagittal slices. Numbers indicate x, y and z slices and are displayed in MNI coordinates. Red color denotes increased GM volume. The color bars indicate the F-value based on one-way ANOVA in three groups. (voxel-P<0.01, cluster- P <0.05, cluster size>50, GRF correction).Abbreviations: GM, gray matter; HC, healthy control; GI: gastrointestinal symptom; GRF, Gaussian Random Field.
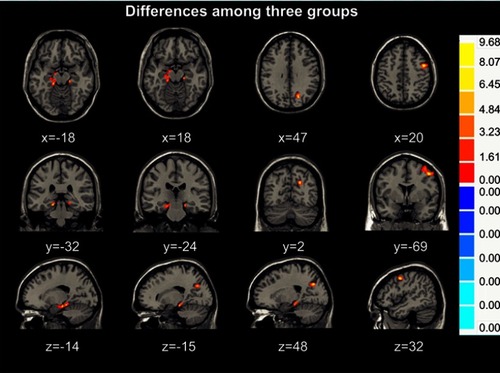
Figure 2 Regional GM volume differences between GI symptoms group and non-GI symptoms group displayed on axial, coronal and sagittal slices. Numbers indicate x, y and z slices and are displayed in MNI coordinates. Red and blue colors denote increased and decreased GM volume. The color bars indicate the T-value based on two-sample t-test. (voxel- P <0.01, cluster- P <0.05, cluster size>50, GRF correction).Abbreviations: GM, gray matter; MNI, Montreal Neurological Institute; GI: gastrointestinal symptom; GRF, Gaussian Random Field.
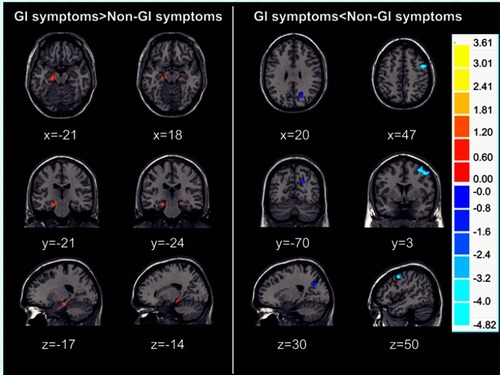
Figure 3 Regional GM volume differences between non-GI symptoms group and HCs group displayed on axial, coronal and sagittal slices. Numbers indicate x, y and z slices and are displayed in MNI coordinates. Red and blue colors denote increased and decreased GM volume. The color bars indicate the T-value based on two-sample t-test. (voxel- P <0.01, cluster- P <0.05, cluster size>50, GRF correction).Abbreviations: HC, healthy control; GM, gray matter; MNI, Montreal Neurological Institute; GI: gastrointestinal symptom; GRF, Gaussian Random Field.
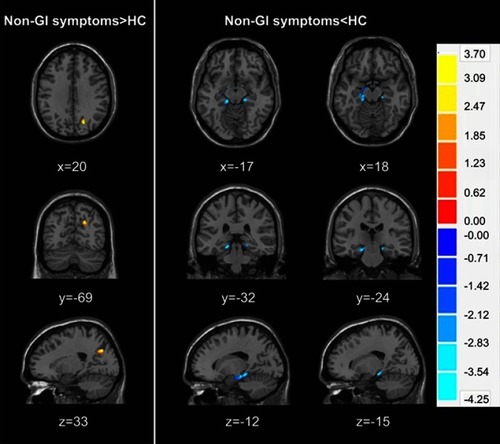
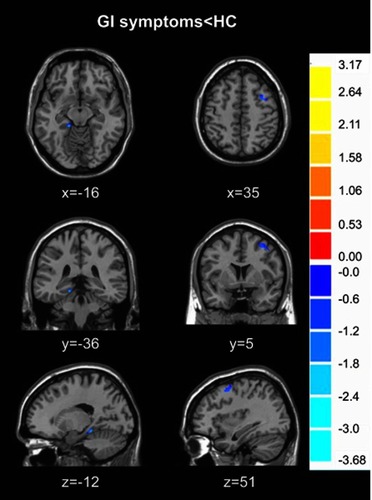
Figure 4 Regional GM volume differences between GI symptoms group and HCs group displayed on axial, coronal and sagittal slices. Numbers indicate x, y and z slices and are displayed in MNI coordinates. Blue color denotes decreased GM volume. The color bars indicate the T-value based on two-sample t-test. (voxel- P <0.01, cluster- P <0.05, cluster size>50, GRF correction).Abbreviations: HC, healthy control; GM, gray matter; MNI, Montreal Neurological Institute; GI: gastrointestinal symptom; GRF, Gaussian Random Field.
Availability of supporting data
The datasets used and/or analyzed during the current study are available from the corresponding author on reasonable request.