Figures & data
Figure 1 Flow chart of all subjects through the study.
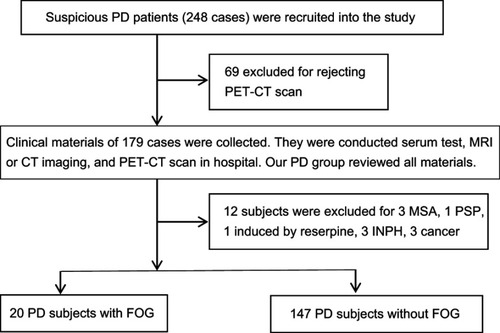
Table 1 Analysis of clinical characteristics in PD patients with FOG
Table 2 Uptake ratio of VMAT2 distribution by 18F-FDG PET-CT in PD patients with FOG
Figure 2 Activities of VMAT2 between the two groups.
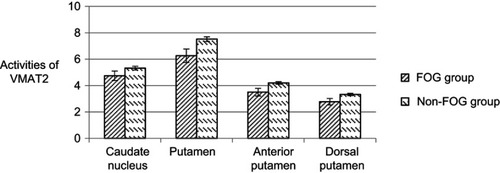
Figure 3 PET-CT image of VMAT2 distribution in a Hoehn–Yahr stage 3 patient with freezing of gait. Two white arrows indicate severe dopamine decline of bilateral putamens in cases.
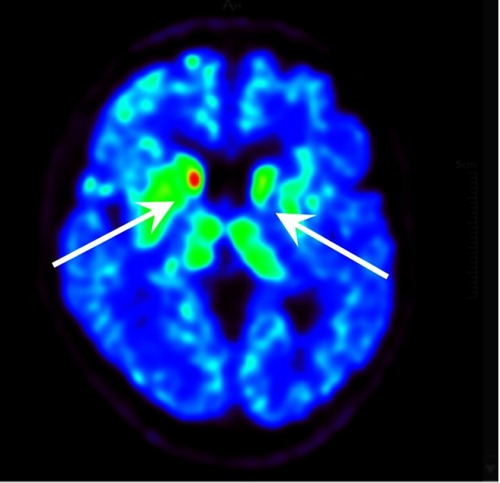
Figure 4 PET-CT image of VMAT2 distribution in a Hoehn–Yahr stage 3 patient without freezing of gait. Two white arrows show the dopamine decline of bilateral putamen.
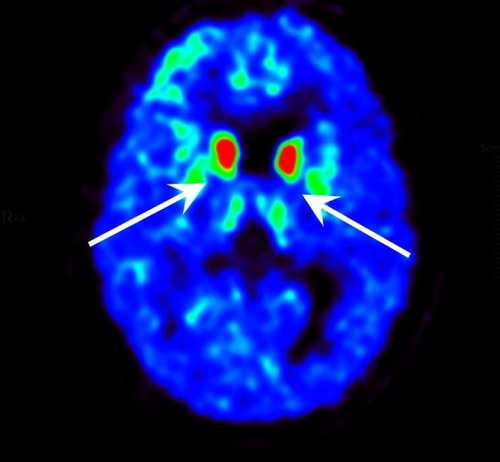
Figure 5 PET-CT image of VMAT2 distribution in a normal person. Two white arrows show the normal dopamine level of bilateral putamen.
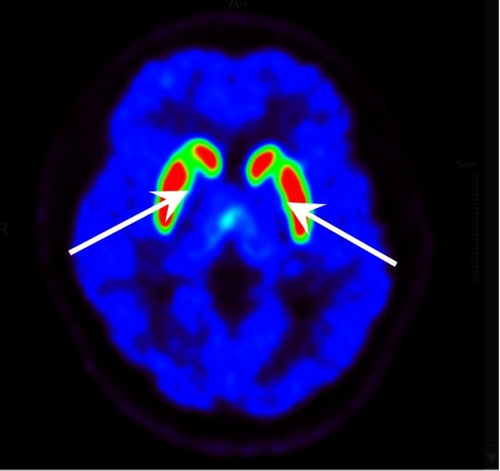
Table 3 Uptake ratios of different brain regions by 18F-FDG PET-CT in PD patients with FOG
Figure 6 Activities of different brain regions between the two groups.
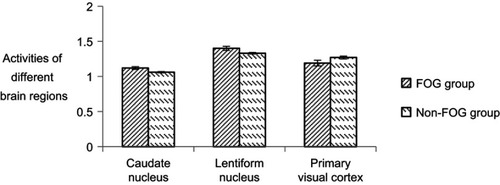
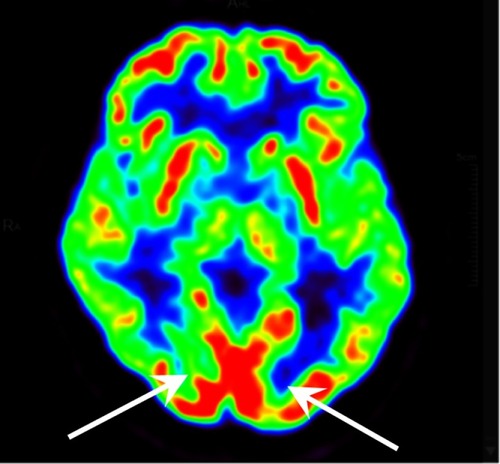
Figure 7 PET-CT image of Hoehn–Yahr stage 3 patient with freezing of gait. Two white arrows show hypometabolism of bilateral primary visualcortex.
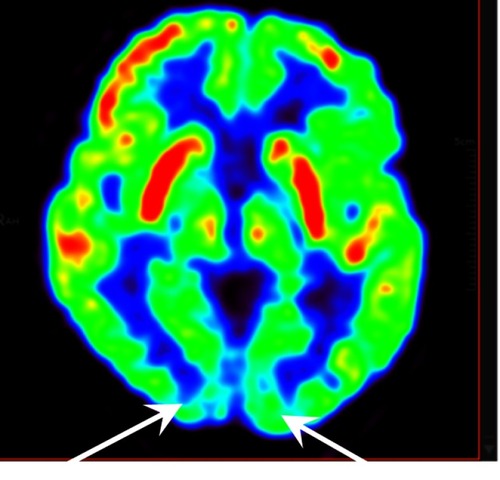
Figure 8 PET-CT imageof Hoehn–Yahr stage 3 patient without freezing of gait. Two white arrows indicate hypermetabolism of bilateral primary visualcortex.
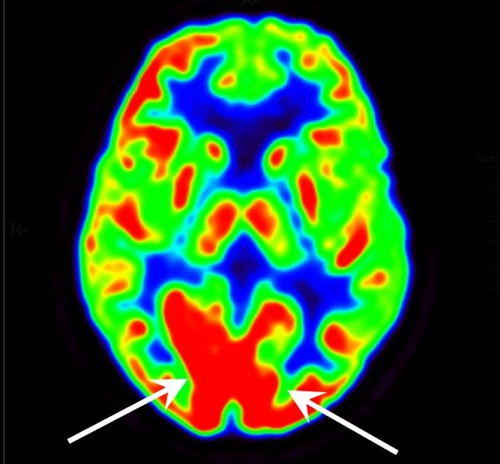
Figure 9 PET-CT image of a normal person. Two white arrows show the normal metabolism of primary visualcortex.