Figures & data
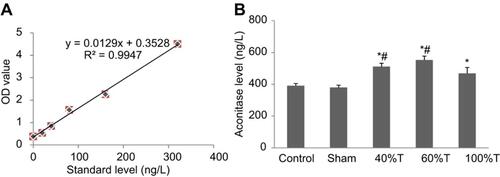
Figure 1 Survival rate of primary hippocampal neurons treated with different intensities of magnetic stimulation. (A) Histogram and (B) table presenting the results. Survival rate is presented as mean±SD; *P<0.05, compared to the control group; #P<0.05, compared to the 40%T and 60%T groups.
Abbreviation: T, intensity.
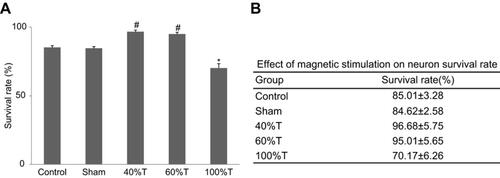
Figure 2 Expression of protein kinase A and catalase in primary hippocampal neurons treated with different intensities of magnetic stimulation. *P<0.05 in comparison with the control group; #P<0.05, compared to the 40%T and 60%T. Repeat ANOVA was used.
Abbreviation: T, intensity.
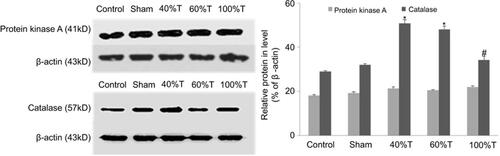
Figure 3 Aconitase concentrations as measured with ELISA in primary hippocampal neurons treated with different intensities of magnetic stimulation. (A) The linear regression equation between the OD value of the standard product and the concentration of aconitase; (B) histogram showing aconitase concentrations. *P<0.05, compared to the control group; #P<0.05 compared to the 100% intensity group.
Abbreviation: T, intensity.