
Figures & data
Figure 1 Simple reaction time test results in the study and control groups.
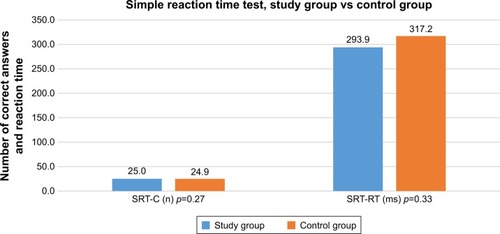
Figure 2 VMT and VMDT results in the study and control groups.
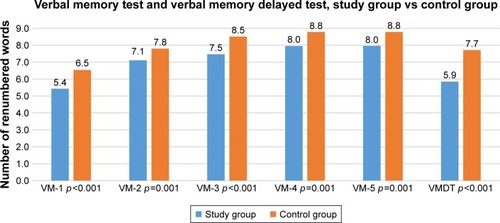
Figure 3 GoNoGo test results in the study and control groups.
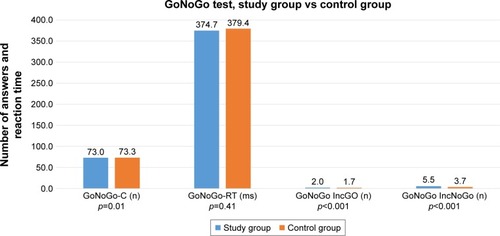
Figure 4 VWMT results in the study and control groups.
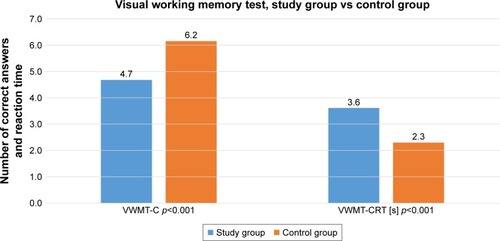
Table 1 Demographic and clinical data of the two prostate cancer therapy subgroups
Table 2 Psychological, clinical, and biochemical parameters in prostate cancer therapy subgroups
Table 3 Cognitive test results for the prostate cancer therapy subgroups
Table 4 R-Spearman correlations between cognitive test results and erectile function before and after surgery in all groups (n=100)
Table 5 R-Spearman correlations between demographic, clinical, psychological, and biochemical factors and erectile function before and after surgery in all groups (n=100)
Table 6 R-Spearman correlations between clinical scales and cognitive test results