Figures & data
Table 1 Demographic and clinical characteristics
Figure 1 The scale of affective disorders in the file.
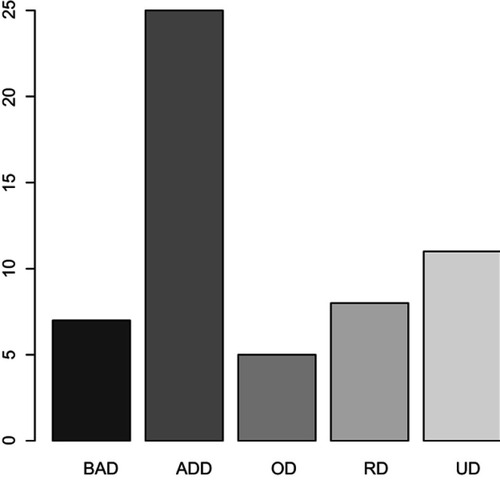
Table 2 Medication
Table 3 SDS Index before and after stimulation
Figure 2 (A) Overall SDS Index after stimulation. (B) Delta SDS Index after stimulation.
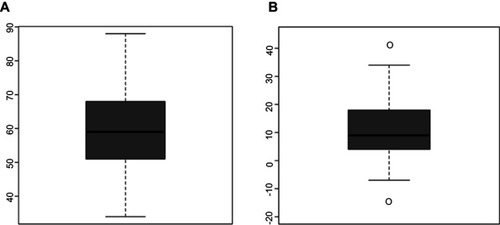
Table 4 Correlation between the change in question 5 and question 7 for the file without unusually long stimulation: The test of correlation: p=0.009
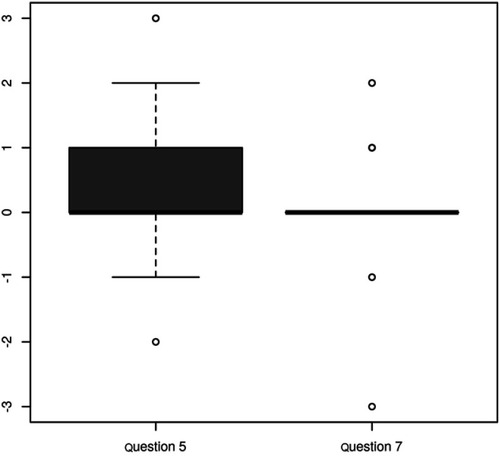
Figure 3 The change in questions 5 and 7 for the file without unusually long stimulation.
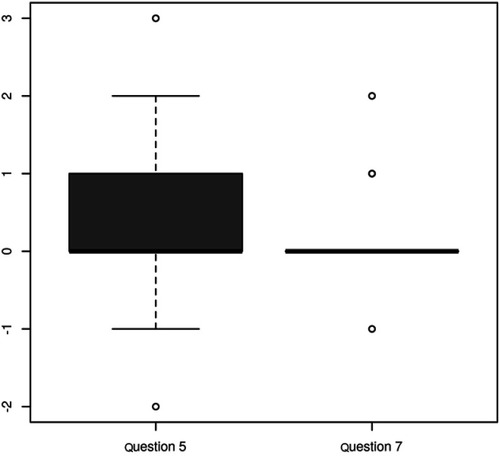
Figure 4 (A) Correlation between the change in question 5 and delta SDS Index for the file without unusually long stimulation. (B) Correlation between the change in question 7 and delta SDS Index for the file without unusually long stimulation.
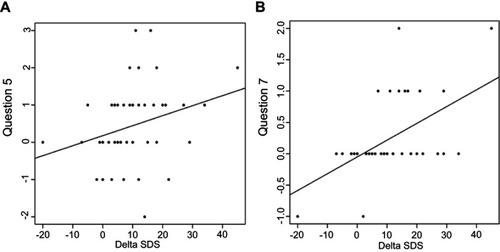
Figure 5 Change in questions 5 and 7 in file with unusually long stimulation.