Figures & data
Table 1 Subject characteristics
Table 2 Multiple logistic regression analyses treating alcohol use status as a dependent variable
Table 3 AUROC and cutoff scores for the AUDIT, CAGE, GGT and the combination of CAGE and GGT
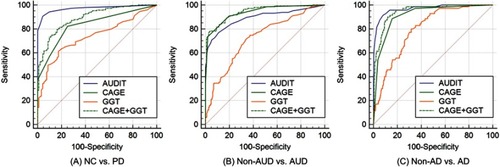
Figure 1 ROC curves of the AUDIT, CAGE, GGT and the combination of CAGE and GGT. Notes: The combined CAGE and GGT scores were calculated by equations derived from multiple logistic regression analyses after adjustment for age and gender.
Abbreviations: AUROC, area under the receiver operating characteristic curves; NC, normal control; PD, problem drinking; AUD, alcohol use disorder; AD, alcohol dependence; AUDIT, alcohol use disorders identification test; CAGE, cutting down, annoyance by criticism, guilty feeling, and eye-openers; GGT, gamma-glutamyl transferase; CAGE+GGT, combination of CAGE and GGT.