
Figures & data
Table 1 Demographic and clinical characteristics among SI, nSI, and general population groupsa
Table 2 Depression-related characteristics among respondents with SI or nSI
Figure 1 Study flowchart: cohort identification.
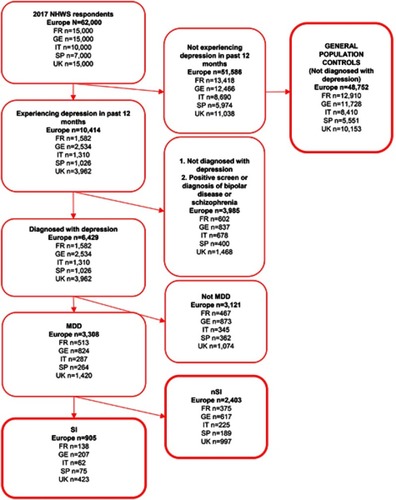
Table 3 Adjusted differences for health-related quality of life among respondents with SI or nSI compared to general population controls
Figure 2 Adjusted risk for (A) WPAI and (B) HRU among respondents with SI or nSI compared to the general population controls.a
Abbreviations: ER, emergency room; HCP, healthcare professional; HRU, healthcare resource use; nSI, non-suicidal ideation; SI, suicidal ideation; WPAI, work productivity and activity impairment.
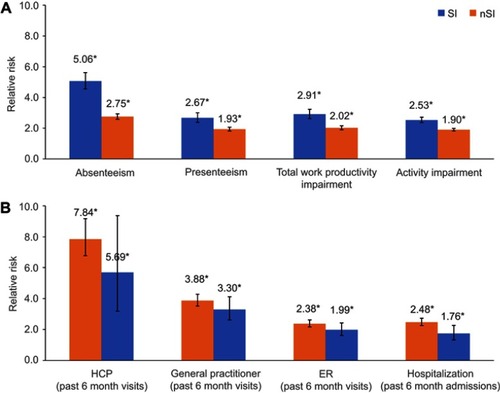
Table S1 Adjusted means for health-related quality of life among respondents with SI and nSI compared to general population controls
Table S2 Adjusted mean percentage work productivity and activity impairment among respondents with SI and nSI compared to general population controls
Table S3 Adjusted means for healthcare resource use among respondents with SI and nSI compared to general population controls